

Two people asked me the same question in the same week. The first was a friend in Scottsdale, Arizona — $240 monthly electricity bill, south-facing roof, excellent credit for a solar loan. The second was a colleague in Buffalo, New York — $95 monthly electricity bill, north-facing back roof, planning to move in four years. My answer to each of them was completely different.
‘Is solar worth it in my area?’ is the most location-sensitive question in residential energy — because the same system, the same panels, and the same installer can deliver outstanding financial returns in one location and borderline economics in another. Everything depends on four local variables: your electricity rate, your peak sun hours, your state’s incentive programme, and your utility’s net metering policy.
This guide gives you a state-by-state and country-by-country verdict on solar value in 2026 — with real payback data, the specific factors driving each rating, and a clear framework for working out whether solar is worth it specifically where you live.
The Key Insight:
| Solar is worth it in the majority of US states in 2026 — but the strength of the financial case varies enormously by location. In Arizona, Hawaii, California, and Massachusetts, solar delivers outstanding returns with payback periods under 8 years. In Louisiana, North Dakota, and parts of the rural Midwest, the combination of low electricity rates and moderate sun hours makes the investment marginal. Your state’s electricity rate is the single most important factor. |
📊 NREL: National Renewable Energy Laboratory — State-by-State Solar Value and ROI Analysis 2026
📌 Also Read:
Is Solar Worth It In Your Area? The 4 Factors That Decide It
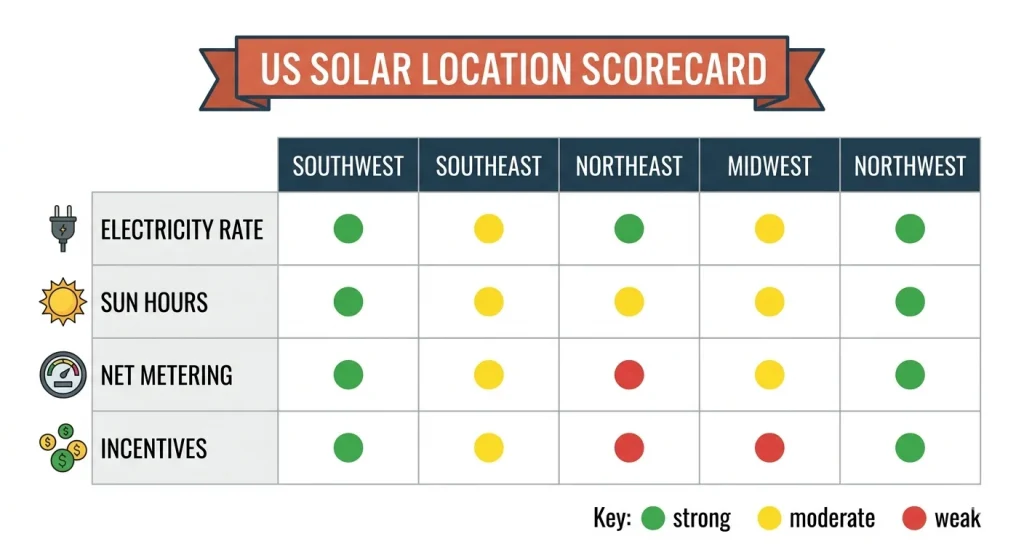
The financial case for solar in any location is determined by four measurable variables. Before looking at specific states, understanding these four factors lets you evaluate any location quickly and accurately.
| Electricity Rate | Peak Sun Hours | State Incentives | Net Metering |
| Factor #1 — most important | Factor #2 — generation driver | Factor #3 — cost reducer | Factor #4 — export value |
Factor 1 — Your Electricity Rate (Most Critical)
The higher your electricity rate, the more valuable every kWh your solar panels generate. States with rates above 20¢/kWh (California, New York, Massachusetts, Hawaii, Connecticut) deliver strong solar returns even in locations with only moderate sun hours. States with rates below 10¢/kWh (Louisiana, Oklahoma, Arkansas) make solar a much harder financial case regardless of sunshine.
Factor 2 — Peak Sun Hours
More sunshine means more generation, lower cost per kWh produced, and faster payback. The US Southwest consistently leads: Arizona (6.5 hrs/day), Nevada (6.2), New Mexico (6.0), and California (5.8) all deliver exceptional generation. The Northeast and Pacific Northwest generate less but can still deliver strong returns when electricity rates are high.
Factor 3 — State and Local Incentives
Beyond the 30% federal ITC, many states offer additional rebates, tax credits, SREC markets, and utility rebate programmes that dramatically reduce net installation costs. New York’s NY-Sun rebate can reduce costs by $7,000 to $9,000. Massachusetts SMART adds ongoing per-kWh payments. New Jersey’s SREC market provides quarterly income certificates. These state-level incentives can be the difference between a good investment and an exceptional one.
The DSIRE database (dsireusa.org) maintains the most comprehensive and up-to-date database of state solar incentives — always check it before requesting installer quotes.
Factor 4 — Net Metering Policy
Net metering determines how much credit you receive for surplus solar electricity you export to the grid. Full retail-rate net metering (California, New Jersey, Massachusetts) means every kWh you export is credited at the same rate you pay for grid electricity. Reduced export compensation (Nevada’s older NEM 3.0, Florida’s net billing) pays you significantly less — reducing the effective value of any excess generation. In states with poor net metering, right-sizing your system to minimise export is especially important.
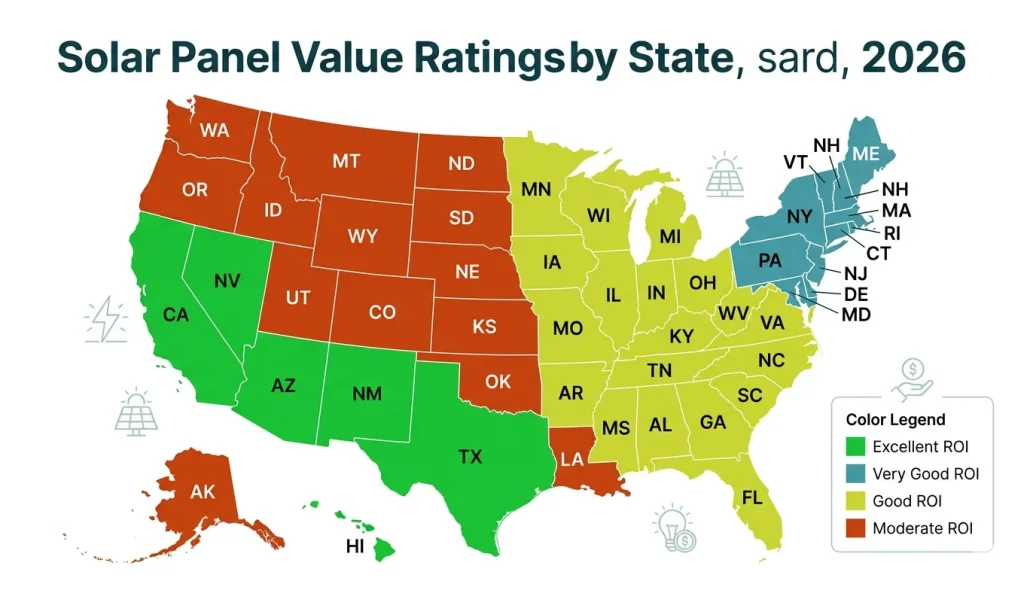
Is Solar Worth It in Your State? Complete US State-by-State Verdict
Here is the comprehensive state-by-state solar value assessment for 2026, based on electricity rates, peak sun hours, state incentives, and net metering strength. Each state receives an overall ROI rating and a clear go/no-go verdict.
| State | Rate/kWh | Sun Hrs | 8kW Net Cost | Payback | 25-Yr Gain | Verdict |
| Hawaii | 42¢ | 5.7 | $19,600 | 4.4 yrs | $102,000 | ⭐⭐⭐⭐⭐ |
| California | 28¢ | 5.8 | $17,920 | 6.8 yrs | $70,000 | ⭐⭐⭐⭐⭐ |
| Arizona | 13¢ | 6.5 | $15,120 | 6.2 yrs | $78,000 | ⭐⭐⭐⭐⭐ |
| Massachusetts | 26¢ | 4.3 | $18,480 | 7.4 yrs | $65,000 | ⭐⭐⭐⭐⭐ |
| Nevada | 13¢ | 6.2 | $15,120 | 6.5 yrs | $66,000 | ⭐⭐⭐⭐⭐ |
| New Mexico | 13¢ | 6.0 | $15,540 | 7.0 yrs | $58,000 | ⭐⭐⭐⭐ |
| New Jersey | 17¢ | 4.6 | $17,360 | 8.2 yrs | $54,000 | ⭐⭐⭐⭐ |
| Connecticut | 24¢ | 4.5 | $19,040 | 8.7 yrs | $52,000 | ⭐⭐⭐⭐ |
| Florida | 13¢ | 5.3 | $16,240 | 7.9 yrs | $55,000 | ⭐⭐⭐⭐ |
| New Hampshire | 22¢ | 4.4 | $19,600 | 9.1 yrs | $48,000 | ⭐⭐⭐⭐ |
| New York | 24¢ | 4.5 | $10,500* | 6.5 yrs | $54,000 | ⭐⭐⭐⭐ |
| Texas | 13¢ | 5.5 | $15,680 | 8.1 yrs | $50,000 | ⭐⭐⭐⭐ |
| Colorado | 14¢ | 5.0 | $16,240 | 8.6 yrs | $48,000 | ⭐⭐⭐ |
| New Mexico | 13¢ | 6.0 | $15,540 | 7.0 yrs | $58,000 | ⭐⭐⭐⭐ |
| Illinois | 13¢ | 4.3 | $14,700* | 8.2 yrs | $42,000 | ⭐⭐⭐ |
| Michigan | 17¢ | 4.0 | $17,360 | 10.0 yrs | $43,000 | ⭐⭐⭐ |
| Georgia | 12¢ | 5.0 | $15,680 | 9.3 yrs | $42,000 | ⭐⭐⭐ |
| Maryland | 15¢ | 4.5 | $17,640 | 9.5 yrs | $44,000 | ⭐⭐⭐ |
| Virginia | 13¢ | 4.7 | $16,800 | 9.8 yrs | $41,000 | ⭐⭐⭐ |
| Ohio | 13¢ | 4.3 | $16,100 | 10.3 yrs | $38,000 | ⭐⭐⭐ |
| Indiana | 12¢ | 4.2 | $15,680 | 11.1 yrs | $33,000 | ⭐⭐ |
| Missouri | 11¢ | 4.5 | $15,120 | 11.5 yrs | $31,000 | ⭐⭐ |
| Kansas | 12¢ | 5.0 | $15,400 | 10.5 yrs | $36,000 | ⭐⭐ |
| Iowa | 11¢ | 4.5 | $15,680 | 11.8 yrs | $29,000 | ⭐⭐ |
| North Dakota | 10¢ | 4.2 | $15,960 | 13.1 yrs | $23,000 | ⭐ |
| Louisiana | 9¢ | 5.0 | $14,000 | 13.0 yrs | $27,000 | ⭐ |
| Wyoming | 10¢ | 5.2 | $15,400 | 12.8 yrs | $25,000 | ⭐ |
* New York and Illinois net costs reflect state rebates applied on top of the 30% federal ITC — NY-Sun rebate (~$1/W additional) and Illinois Shines SREC income are major contributors. Always check the DSIRE database for your state’s current incentive programmes.
📊 EnergySage: EnergySage — Is Solar Worth It In Your State? Complete 2026 Guide
The Best States for Solar in 2026 — Deep Dive
These five states consistently deliver the strongest solar ROI in the US in 2026. If you live in any of them, solar is almost certainly worth serious consideration.
1. Hawaii — Exceptional ROI, Fastest Payback
Hawaii is the undisputed solar leader in the US. With the highest electricity rate in the country (42¢/kWh), excellent sunshine (5.7 peak hours/day), and strong net billing programmes, Hawaiian homeowners see payback periods of 4 to 5 years and 25-year net gains exceeding $100,000. High installation costs (up to $3.50/W) are offset by extraordinary savings per kWh. Grid electricity is uniquely expensive in Hawaii due to the island’s dependence on imported oil — making solar’s value proposition exceptionally strong.
Verdict: Solar is almost always worth it in Hawaii for homeowners with a south or east-facing roof. The combination of high rates and good sun makes it one of the world’s best solar markets.
2. California — High Rates + Best-in-Class Net Metering
California combines a 28¢/kWh electricity rate with 5.8 peak sun hours and California’s NEM 3.0 net metering programme. While NEM 3.0 reduced export compensation compared to the previous programme, self-consumed solar remains highly valuable. The California Solar Initiative provides additional incentives for low and moderate-income households. Strong installer competition keeps installation costs competitive.
Verdict: Solar is strongly worth it in California, particularly for homeowners who can maximise self-consumption. A 6 to 7-year payback and lifetime savings of $65,000 to $75,000 are realistic for average households.
3. Arizona — World-Class Sun, Strong Economics
Arizona has the highest peak sun hours of any US state at 6.5 hours per day — meaning Arizona solar panels generate approximately 45% more electricity annually than the same system in New York. Even with a moderate electricity rate of 13¢/kWh, the sheer volume of generation makes the economics compelling. Property tax exemption for solar equipment further improves net returns.
Verdict: Solar is clearly worth it in Arizona. A 6 to 7-year payback and 25-year gain of $75,000 to $85,000 are achievable. Arizona is the best US market for pure solar generation efficiency.
4. Massachusetts — High Rates + Best State Incentive Stack in the US
Massachusetts has both a high electricity rate (26¢/kWh) and the most comprehensive state incentive programme in the country. The SMART programme provides per-kWh compensation for 10 years on top of net metering. Additional state income tax credits and property tax exemptions compound the benefit. The main limitation is moderate sun hours (4.3/day) compared to southwestern states.
Verdict: Solar is strongly worth it in Massachusetts. Between the federal ITC, SMART programme, and net metering, Massachusetts homeowners often achieve the lowest effective net cost per kWh of solar electricity in the country.
5. Nevada — Sun Belt Leader with Competitive Installer Market
Nevada’s combination of 6.2 peak sun hours and an established installer market (driven by Las Vegas and Reno demand) produces strong economics. NV Energy’s net metering programme has undergone changes but still provides meaningful export compensation. State property tax exemption for solar equipment reduces ongoing costs.
Verdict: Solar is worth it in Nevada. The strong sun hours partially compensate for the moderate electricity rate (13¢/kWh), producing payback periods of 6 to 7 years and strong lifetime returns.
States Where Solar Is Marginal — What You Need to Know
Solar can still make financial sense in these states, but the economics are less compelling and the decision requires more careful personal analysis.
Louisiana — Low Rates Make Solar Challenging
Louisiana has one of the lowest electricity rates in the country at 9¢/kWh — which means each kWh of solar generation is worth less than half what it is worth to a California homeowner. Despite decent sun hours (5.0/day), the low rate extends payback periods to 12 to 14 years. Solar can still be worthwhile for homeowners who plan to stay long-term and have high consumption, but it requires a patient investment horizon.
- Best case: High-usage home ($200+/month bill), long-term owner (15+ years), quality installer
- Worst case: Moderate usage, likely to move within 8 years, poor roof orientation
North Dakota / Wyoming / Iowa — Low Rates and Northern Sun Hours
These states face a double challenge: electricity rates are low (9¢ to 11¢/kWh) and peak sun hours are moderate (4.0 to 5.2/day). Payback periods of 12 to 15 years are common. Solar can work for homeowners with high consumption, strong roofs, and long time horizons — but it is not the automatic win it is in southern or northeastern markets.
Ohio / Indiana / Missouri — Improving but Still Moderate
These states have seen electricity rates rise significantly since 2020 (Ohio now averages 13¢/kWh, up from 10¢), improving the solar case meaningfully. Payback periods of 10 to 12 years are typical. The lack of strong state-level incentive programmes (unlike New York, Massachusetts, or New Jersey) means the federal ITC alone is the primary financial lever. Solar is worth considering for high-usage homeowners but is not the compelling investment it is in coastal or southwestern markets.
Is Solar Worth It in the UK, Australia, Canada, and Other Countries?
Outside the US, the solar value calculation follows the same four-factor framework — electricity rate, sun hours, government incentives, and export compensation. Here is the verdict for the top international markets:
| Country | Rate/kWh | Sun Hrs | Key Incentive | Payback | 25-Yr Return | Rating |
| Australia | 30¢ AUD | 5.3 hrs | STC rebates ~30% | 4–6 yrs | AUD $82,000 | ⭐⭐⭐⭐⭐ |
| Spain | 29¢ EUR | 5.2 hrs | Regional rebates 20% | 5–7 yrs | €40,000 | ⭐⭐⭐⭐⭐ |
| UAE | 8¢ USD | 6.0 hrs | None / minimal | 5–7 yrs | $50,000+ | ⭐⭐⭐⭐ |
| Germany | 31¢ EUR | 3.5 hrs | 20% VAT exempt | 7–10 yrs | €35,000 | ⭐⭐⭐⭐ |
| Netherlands | 32¢ EUR | 2.7 hrs | 21% VAT exempt | 8–10 yrs | €33,000 | ⭐⭐⭐⭐ |
| United Kingdom | 34p | 2.8 hrs | Zero VAT + SEG | 11–13 yrs | £18,500 | ⭐⭐⭐ |
| Canada (avg) | 13¢ CAD | 4.0 hrs | Canada Greener ~30% | 11–13 yrs | CA$36,000 | ⭐⭐⭐ |
| India | 7¢ USD | 5.5 hrs | 30–40% subsidy | 6–9 yrs | ₹840,000 | ⭐⭐⭐⭐ |
| South Africa | 12¢ USD | 5.5 hrs | Limited | 8–10 yrs | $35,000 | ⭐⭐⭐ |
| Pakistan | 3¢ USD | 5.8 hrs | Limited | 10–15 yrs | $15,000 | ⭐⭐ |
Australia — The World’s Best Solar Market
Australia has the best combination of solar value factors of any major developed economy. High electricity rates (averaging 30¢ AUD/kWh), good sun hours (5.3/day nationally, 5.8 in Queensland and South Australia), generous STC government rebates, and a mature competitive installer market producing some of the world’s lowest installation costs per kW combine to create extraordinary ROI. Average payback periods of 4 to 6 years and 25-year net gains of AUD $70,000 to $90,000 make Australia a global leader.
United Kingdom — Worth It Despite Limited Sun
The UK presents an interesting case: low peak sun hours (2.8/day average) are offset by very high electricity rates (34p/kWh). This means each kWh of solar generation is highly valuable even though the system generates less than half what an equivalent system produces in Arizona. The Smart Export Guarantee provides additional income for exported electricity. Zero VAT on solar installations reduces upfront cost. The financial case is solid but requires a longer time horizon (11 to 13 years payback) than sunnier markets.
Canada — Variable by Province
Canada’s solar value varies enormously by province. British Columbia and Ontario have electricity rates near 12 to 14¢ CAD/kWh with moderate sun hours — producing 10 to 13 year paybacks. Alberta has higher rates and good southern sun hours, producing better economics. Canada Greener Homes Grant provides up to CA$5,000 in federal incentives plus low-interest loan financing. Quebec has very low electricity rates due to abundant hydropower — making solar marginal in that province specifically.
How to Do Your Own ‘Is Solar Worth It In My Area?’ Check in 5 Minutes
You do not need a site visit or installer quote to get a strong first-pass answer for your specific location. Here is the five-minute self-assessment process:
Step 1 — Check Your Electricity Rate
Find your most recent electricity bill and look for the rate in cents per kWh (or the total kWh used divided into the energy charge portion of your bill). If your rate is above 15¢/kWh, solar is likely financially strong in most markets. Below 10¢/kWh, solar requires careful evaluation.
Step 2 — Look Up Your Peak Sun Hours
The NREL PVWatts calculator allows you to look up peak sun hours for any US location by address. Alternatively, our solar energy calculator by ZIP code does this automatically. As a rough guide: anything above 5.0 hours/day is excellent, 4.0 to 5.0 is good, 3.0 to 4.0 is moderate.
Step 3 — Research Your State Incentives
Beyond the federal 30% ITC, check the DSIRE database (dsireusa.org) for state-level rebates, SREC programmes, and utility incentives. Some states have incentive stacks worth $5,000 to $10,000 over the federal ITC alone. Check your utility’s net metering policy — call them directly or check their website under ‘solar’ or ‘net metering’.
Step 4 — Run Your Numbers
With your electricity rate, location sun hours, and incentive information in hand, plug them into solar savings calculator to get a personalised estimate of monthly savings, payback period, and 25-year return for your specific home.
Step 5 — Get 3 Installer Quotes
Once your calculator estimate suggests solar is financially viable for your location, get at least three quotes from NABCEP-certified installers. Real quotes will refine the estimate significantly — factoring in your specific roof, shading profile, and any electrical upgrade requirements. Compare total project cost, not just per-panel price.
Location Factors You Can and Cannot Control
Some solar location factors are fixed — you cannot change your latitude, your state’s electricity rate structure, or your utility’s net metering policy. But several factors that significantly affect your solar economics are within your control, regardless of where you live.
What You Cannot Change
- Peak sun hours — determined by latitude and climate
- State electricity rate structure — set by your utility and state regulators
- Net metering compensation rate — set by your utility and state commission
- Seasonal daylight variation — shorter winter days at higher latitudes
What You Can Control
- Roof orientation — choosing the best available slope on your property for panel placement
- Shading management — trimming trees or selecting panel placement that minimises shade impact
- System size — correctly sizing to cover your actual usage maximises your economics
- Installer selection — getting multiple quotes reduces your net cost by 20–30% in competitive markets
- Appliance timing — shifting consumption to solar generation hours increases effective savings
- Battery addition — in poor net metering markets, battery storage can significantly improve economics by increasing self-consumption
Frequently Asked Questions
Is solar worth it in cloudy or rainy climates?
Yes — solar panels still generate electricity on cloudy days, just at reduced output (typically 10 to 25% of peak output on overcast days). The UK, Germany, and the Netherlands all demonstrate this: despite limited sun hours, solar panels deliver worthwhile returns because of high electricity rates. The key is that cloudy markets require larger systems to produce the same annual generation — which increases upfront costs — but the high electricity rate compensates. A UK homeowner with a 34p/kWh rate saves as much per kWh of generation as many US Sun Belt homeowners despite generating far fewer kWh.
Does solar work in cold climates?
Yes — and sometimes better than expected. Solar panels actually operate more efficiently at lower temperatures; heat reduces panel efficiency. The challenge in cold climates is not temperature but daylight hours and cloud cover. States like Minnesota, Wisconsin, and Michigan can have strong solar economics if their electricity rates are high enough to compensate for lower winter generation. Seasonal snow coverage is a concern but panels are typically installed at angles that cause snow to slide off naturally after a day or two.
Is solar worth it if I have a low electricity bill?
If your monthly electricity bill is consistently below $80, solar becomes a marginal investment in most US markets. With lower consumption, a smaller system is needed — but the savings are also proportionally smaller, and the payback period extends to 13 to 18 years in many cases. Below $60 per month, solar is generally not financially recommended unless you have unusually high electricity rates or expect consumption to increase significantly (EV purchase, family expansion).
Does my state’s net metering policy really matter that much?
Yes — more than most people realise. In a state with full retail-rate net metering, every kWh of surplus solar you export to the grid is credited at the same rate you pay to import electricity. In a state with reduced export compensation (Nevada, Florida above certain thresholds), exported electricity is credited at 2 to 3¢ below retail. For a system that exports 30% of its generation, this difference can reduce annual savings by $150 to $400 per year — adding 1 to 2 years to the payback period. Always check your utility’s current net metering programme before sizing your system.