
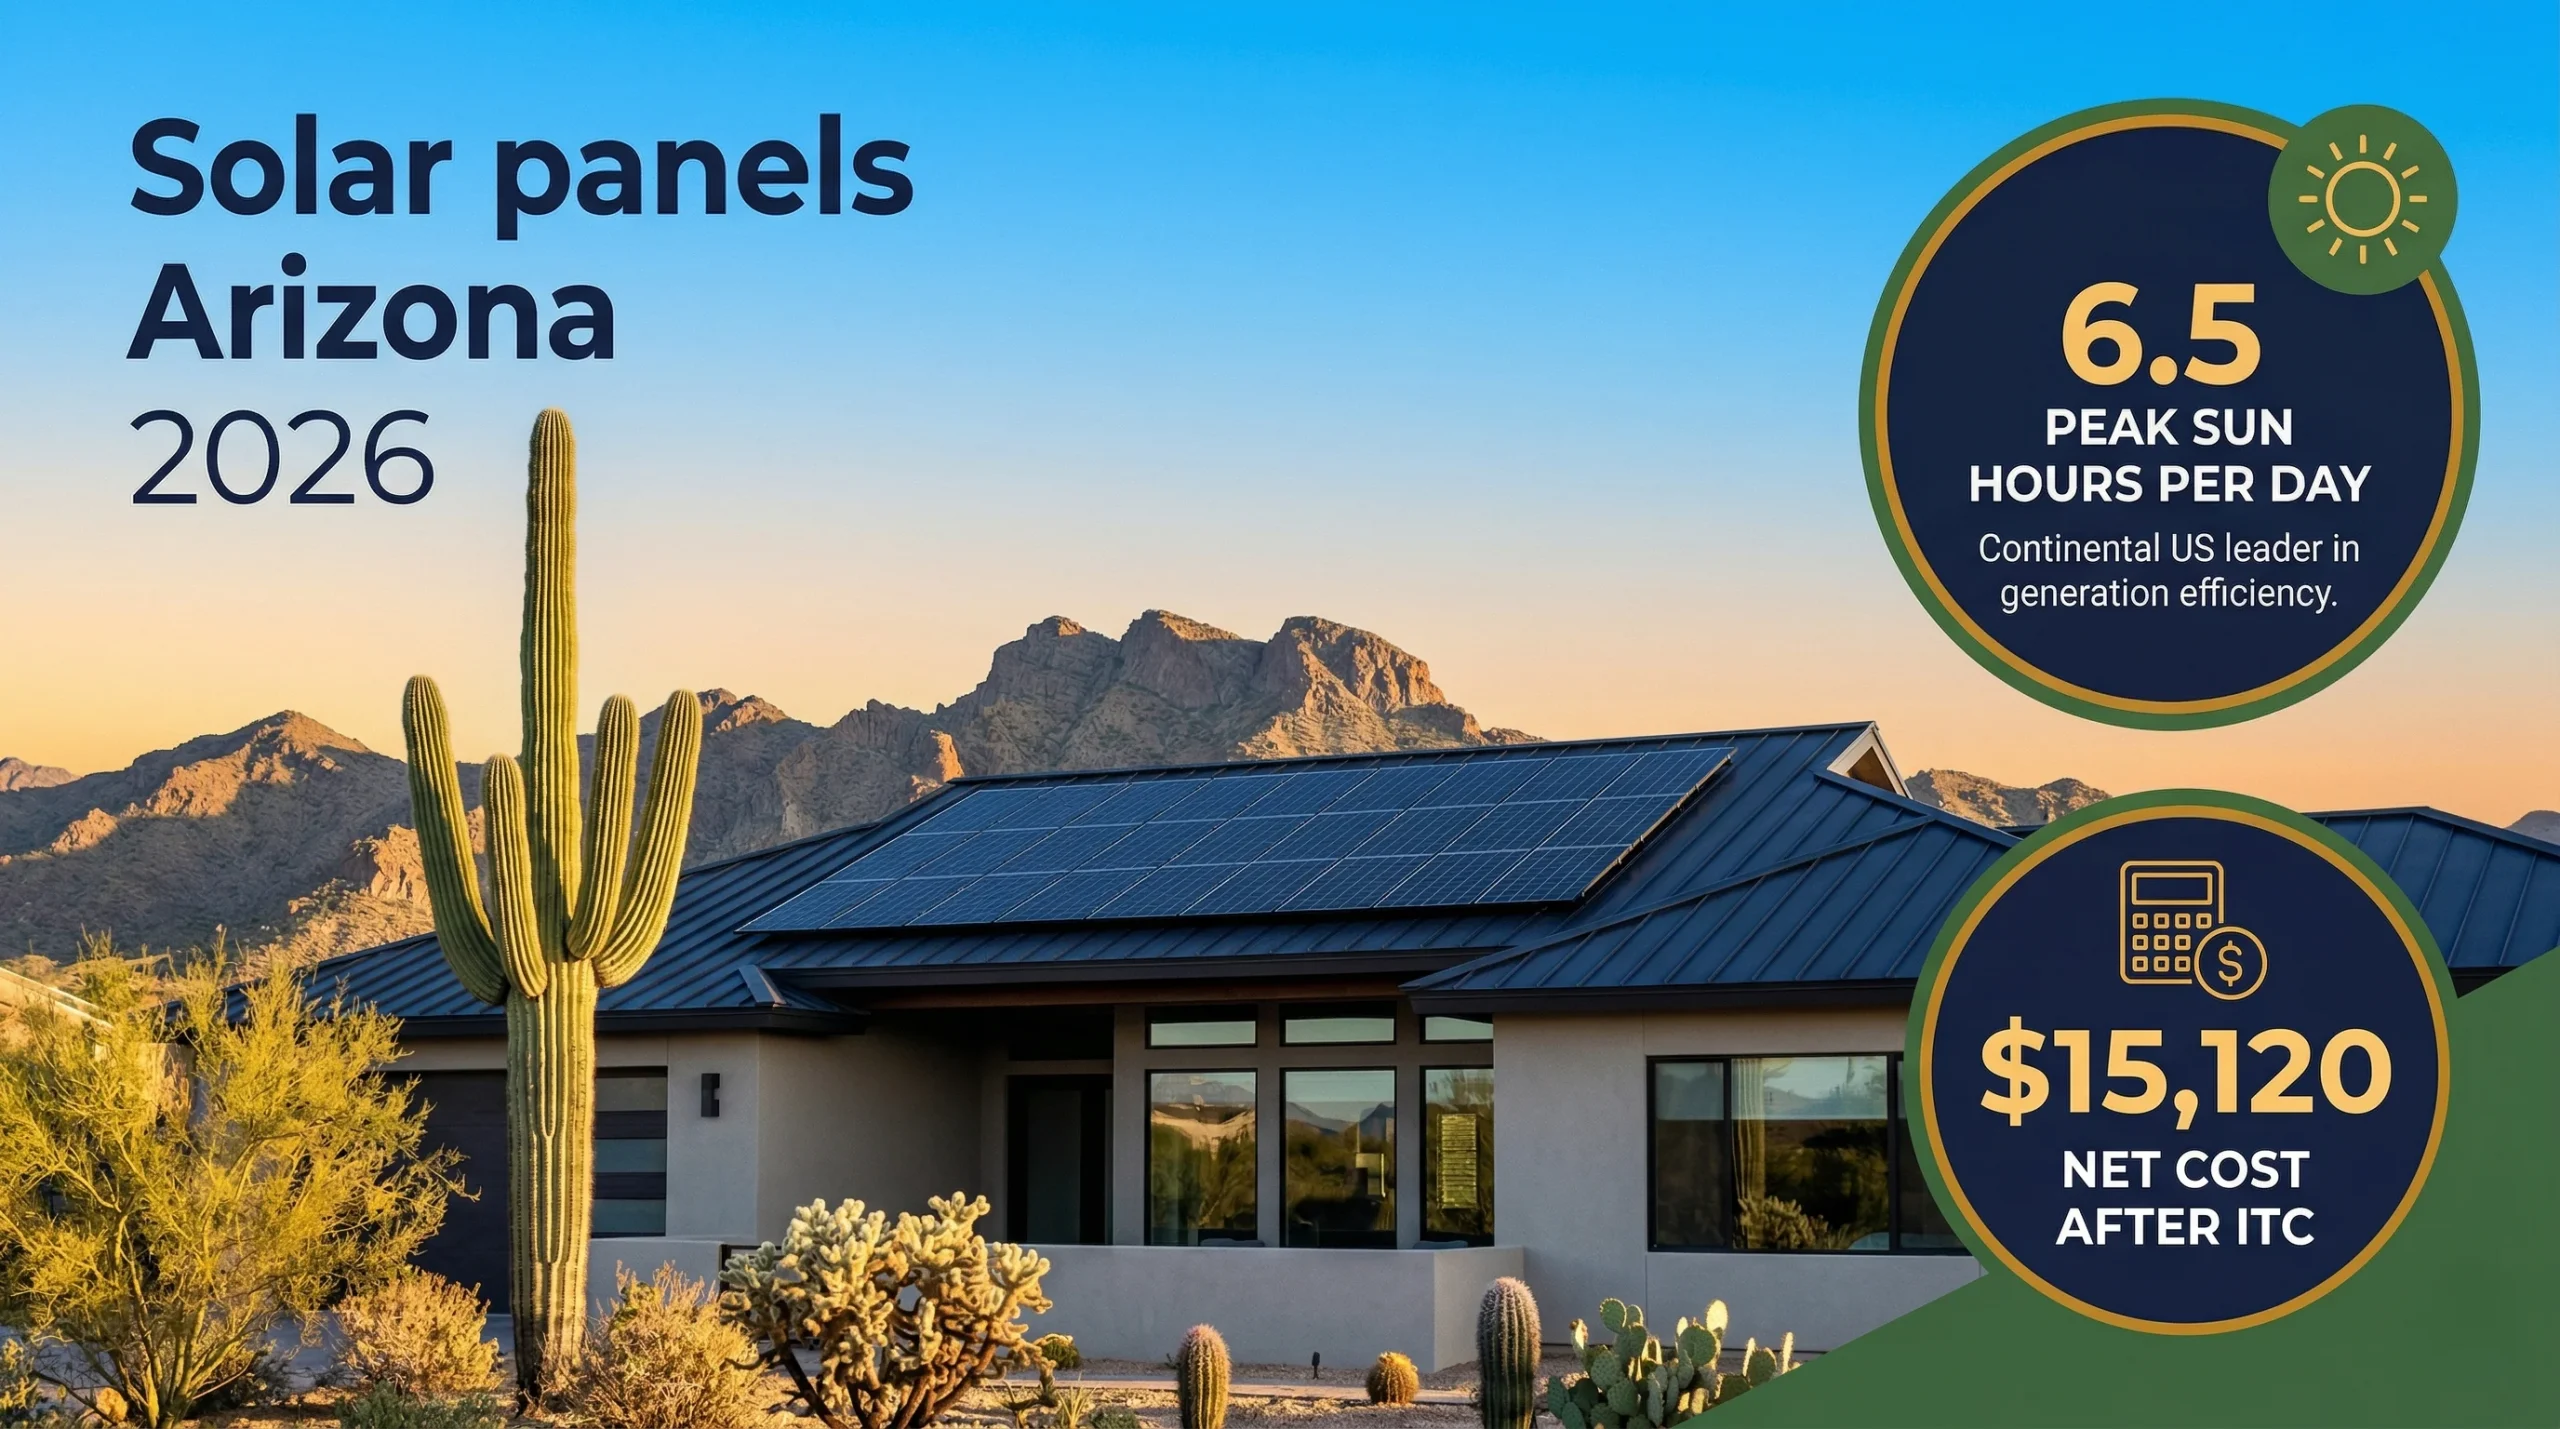
Arizona is the solar capital of the continental United States — and the data makes the case without equivocation. The state averages 6.5 peak sun hours per day, with Yuma recording over 7.0 — the highest annual solar irradiance of any major US city. Over 300 sunny days per year. Summer temperatures that drive electricity bills to $300 to $450 per month for many Phoenix and Tucson households. A competitive installer market that has grown dramatically over the past decade.
The financial case for Arizona solar in 2026 is not subtle. A correctly sized solar system for a Phoenix home eliminates 85 to 100% of the electricity bill during the system’s peak generation months — and the 30% federal ITC, property tax exemption, and sales tax exemption stack to reduce the net installation cost to among the lowest in the US relative to the savings delivered.
This guide covers everything Arizona homeowners need — costs by system size, savings by city, APS and SRP net metering policies compared, every available incentive, and the complete payback picture for 2026.
Arizona Solar 2026 — The Bottom Line:
| An 8kW solar system in Arizona costs $14,560 to $17,360 net after the 30% ITC. Annual savings range from $2,200 to $3,200 depending on utility and location. Payback periods run 5 to 8 years. Arizona’s 6.5 average peak sun hours produce more electricity per installed kW than anywhere else in the continental US. Combined with property and sales tax exemptions, Arizona delivers some of the best solar ROI in the country. |
📌 Also Read:
| → Are Solar Panels Worth It? — AZ Rated ⭐⭐⭐⭐⭐ → Federal Solar Tax Credit: Complete 2026 Guide → How Much Do Solar Panels Save? — AZ State Data |
Arizona Solar Costs in 2026
Arizona’s competitive installer market — driven by strong demand across the Phoenix metro area, Tucson, Scottsdale, Mesa, and Chandler — keeps installation costs near national averages despite the higher labour environment. In 2026, residential solar costs $2.60 to $3.10 per watt.
| System | Gross Cost | After 30% ITC | Monthly Saving | Annual Saving | Payback |
| 5 kW | $13,000–$15,500 | $9,100–$10,850 | $145–$180/mo | $1,740–$2,160 | 6–7 yrs |
| 6 kW | $15,600–$18,600 | $10,920–$13,020 | $175–$215/mo | $2,100–$2,580 | 6–8 yrs |
| 8 kW | $20,800–$24,800 | $14,560–$17,360 | $220–$280/mo | $2,640–$3,360 | 5–7 yrs |
| 10 kW | $26,000–$31,000 | $18,200–$21,700 | $275–$345/mo | $3,300–$4,140 | 6–8 yrs |
| 12 kW | $31,200–$37,200 | $21,840–$26,040 | $330–$410/mo | $3,960–$4,920 | 6–8 yrs |
Solar Savings by Arizona City — Real 2026 Data
| City | Rate | Peak Sun | Monthly Saving (8kW) | Annual Saving | Payback |
| Yuma | 12¢/kWh | 7.0 hrs | $235–$300/mo | $2,820–$3,600 | 5–7 yrs |
| Phoenix (APS) | 13¢/kWh | 6.5 hrs | $220–$280/mo | $2,640–$3,360 | 5–7 yrs |
| Scottsdale/Mesa (APS) | 13¢/kWh | 6.5 hrs | $220–$280/mo | $2,640–$3,360 | 5–7 yrs |
| Tucson (TEP) | 13¢/kWh | 6.4 hrs | $215–$275/mo | $2,580–$3,300 | 6–8 yrs |
| Flagstaff (APS) | 13¢/kWh | 5.5 hrs | $185–$235/mo | $2,220–$2,820 | 7–9 yrs |
| Prescott (APS) | 13¢/kWh | 5.8 hrs | $195–$245/mo | $2,340–$2,940 | 7–9 yrs |
Yuma’s extraordinary 7.0 peak sun hours per day means an 8kW solar system generates approximately 16,500 kWh per year — compared to 11,700 kWh in New York. That additional generation directly reduces your electricity bill and accelerates payback. For large consumption households in Yuma (common with heavy AC use), an 8kW system can fully eliminate the electricity bill during spring, autumn, and many summer months.
APS vs SRP — Net Metering Policies Compared
The two major utilities serving the Phoenix metro area have very different solar programmes — a critical distinction for homeowners when sizing their system.
APS (Arizona Public Service) serves most of Greater Phoenix, Scottsdale, Tempe, Mesa, Chandler, Gilbert, Flagstaff, Yuma, and Prescott. Under APS’s current NEM 2.0 programme, homeowners receive full retail rate credit for exported solar electricity — the same 13¢/kWh they pay to import. This is one of the most favourable residential net metering policies remaining in the US. APS customers should size their systems to cover 90 to 100% of annual consumption.
SRP (Salt River Project) serves a large portion of the Phoenix East Valley including Gilbert, Chandler, Queen Creek, and parts of Tempe. SRP uses a demand-based pricing model (the E-27 Solar Price Plan) that charges a monthly fee based on peak demand in 15-minute intervals in addition to energy-based charges. For SRP customers, oversized solar systems without battery storage can trigger higher demand charges during cloudy periods. SRP customers benefit significantly from battery storage, which smooths demand spikes.
TEP (Tucson Electric Power) serves Tucson and surrounding areas with its own solar rate programme — generally favourable for residential systems with time-of-use pricing that benefits homeowners with daytime consumption or battery storage.
Arizona Solar Incentives 2026
- Federal 30% ITC: available through 2032. On an $22,000 system, this is $6,600 off your federal tax bill. No income cap. Claims IRS Form 5695.
- Property Tax Exemption: Arizona Revised Statutes 42-11054 exempts the added home value from solar from property tax assessment. Saves $300 to $900 per year on typical AZ tax rates.
- Sales Tax Exemption: Solar energy equipment is exempt from Arizona’s 5.6% state transaction privilege tax, saving approximately $1,200 to $1,800 on a typical 8kW system.
- No state income tax credit: Arizona eliminated its residential solar income tax credit in 2021. However, the federal ITC alone — combined with exceptional solar generation economics — makes Arizona one of the strongest ROI markets in the US without any state credit.
📌 Also Read:
| → Solar Rebate by State 2026 — AZ Exemptions Listed → How Many Solar Panels to Power a House? Arizona Sizing → How Much Do Solar Panels Cost Per Month? AZ Finance |
Arizona Solar and Summer Heat — What Homeowners Should Know
Arizona’s intense summer heat creates a nuance that surprises first-time solar owners: solar panels operate less efficiently at high temperatures. Most panels lose approximately 0.3 to 0.5% efficiency per degree Celsius above 25°C (77°F) — a property called the temperature coefficient. In Phoenix summers where roof surface temperatures can reach 70 to 80°C (158 to 176°F), panels may produce 10 to 18% less than their standard test condition rating.
The practical impact is moderated by two factors: first, Arizona’s long summer days and intense solar irradiance partially compensate for efficiency losses. Second, spring and autumn months with high irradiance and mild temperatures are actually the peak generation periods for Arizona solar systems. Year-round, Arizona systems generate significantly more per installed kW than any other continental US location. When comparing panel specifications, look for lower temperature coefficients (closer to 0.30%/°C) for best Arizona performance.
Frequently Asked Questions — Arizona Solar 2026
What is the solar payback period in Arizona in 2026?
For APS customers (most of Phoenix metro): 5 to 7 years after the 30% ITC. Yuma and other high-sun areas achieve payback at the shorter end of this range. Flagstaff and higher-elevation areas with slightly lower sun hours: 7 to 9 years. SRP customers with battery storage: similar to APS at 6 to 8 years. Arizona consistently has among the shortest solar payback periods of any state with moderate electricity rates.
Is Arizona’s net metering policy secure for new installations?
APS’s current NEM 2.0 programme is available to new installations in 2026. Arizona historically has experienced NEM policy debates — the CPUC previously considered reductions — but APS’s current programme has been stable. The 30-year horizon of solar panel warranties means future policy changes are always possible; however, the direct self-consumption value of solar (the majority of financial benefit) is unaffected by any net metering policy change.
What Arizona cities are best for solar?
Yuma leads all Arizona cities with 7.0 peak sun hours per day — the highest in the continental US. Phoenix, Scottsdale, Mesa, and Chandler all average 6.5 peak sun hours. Tucson at 6.4 and Prescott at 5.8 are strong performers. Flagstaff at 5.5 peak sun hours is the most modest of Arizona’s major cities — still excellent by national standards, but notably lower than the desert communities to the south.
How big a solar system does an average Phoenix home need?
The average Phoenix household consumes approximately 1,200 kWh per month annually — surging to 1,800 to 2,500 kWh in July and August due to AC. A correctly sized system for a typical 3-bedroom Phoenix home typically needs 8 to 10kW to achieve 90%+ annual coverage. Homes with pools, multiple AC units, or EV charging should size for 10 to 14kW. For detailed sizing guidance, see our article on how many solar panels are needed to power a house.