
When I was researching solar panels for my own home, the question I kept coming back to was not the upfront cost — it was the savings. The salesperson from the first company I spoke to told me I would save ‘around $150 a month.’ The second company said ‘$120 to $180.’ The third said ‘up to $200.’ Every answer was different, and none of them explained where the numbers came from.
It took me several hours of digging through NREL datasets, EnergySage reports, and my utility’s rate schedule to actually understand what drives solar savings — and why the estimates vary so much. The short answer is that how much solar panels save depends almost entirely on where you live and how much you currently pay for electricity. The long answer is what this article covers in full.
In this guide, you will find real solar savings data by US state and country, a clear breakdown of the four ways solar reduces your costs, honest figures for monthly and annual savings at different household sizes, and the precise calculation method so you can work out your own numbers with confidence. Here is our Solar Panel Calculator 2026.
The Key Number:
| The average US homeowner with solar panels saves between $1,200 and $2,400 per year on electricity — that is $100 to $200 per month. But state-by-state, the range runs from under $800/year in low-rate states to over $3,000/year in high-rate states like Hawaii and California. Your electricity rate is by far the biggest single factor in your savings. |
📊 NREL: National Renewable Energy Laboratory — Residential Solar Savings Benchmarks 2026
How Much Do Solar Panels Save on Average in 2026?
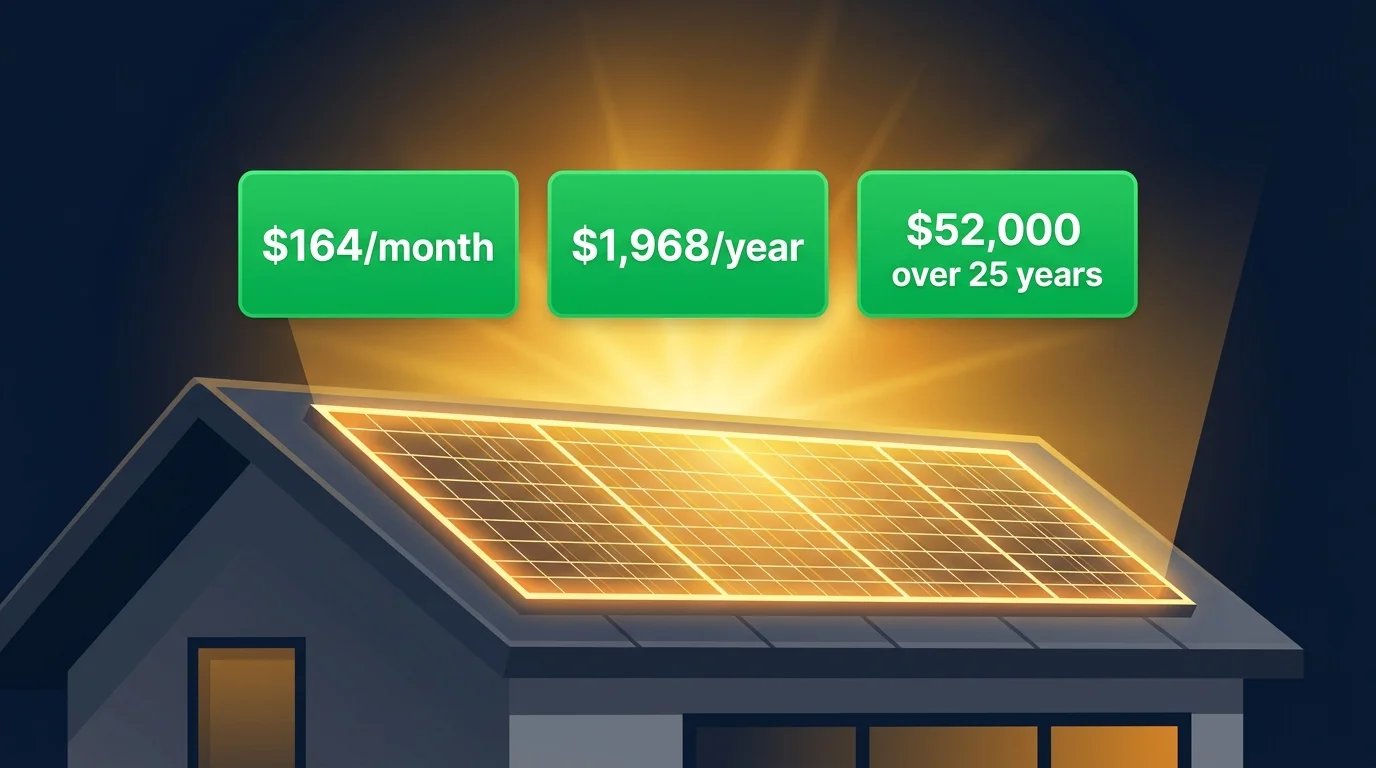
The national average for US homeowners with solar panels in 2026 is a saving of $1,500 to $2,000 per year on electricity bills — roughly $125 to $167 per month. But that average conceals enormous variation. A homeowner in Arizona with a $280 monthly electricity bill can realistically save $2,800 to $3,200 per year. A homeowner in Louisiana with a $90 monthly bill and a low electricity rate might save only $600 to $800 per year with the same size system.
Understanding why there is such a wide range — and where your situation falls within it — is the entire point of this guide. Let us start with the national picture before drilling into the state and country level data.
| $1,500–$2,000 | $125–$167/mo | $37K–$50K | ~900 kWh/mo |
| Avg. US annual savings | Avg. US monthly savings | Avg. US 25-year savings | Avg. US household usage |
These averages are based on a standard 6–8kW system covering roughly 80–100% of a typical household’s electricity consumption.
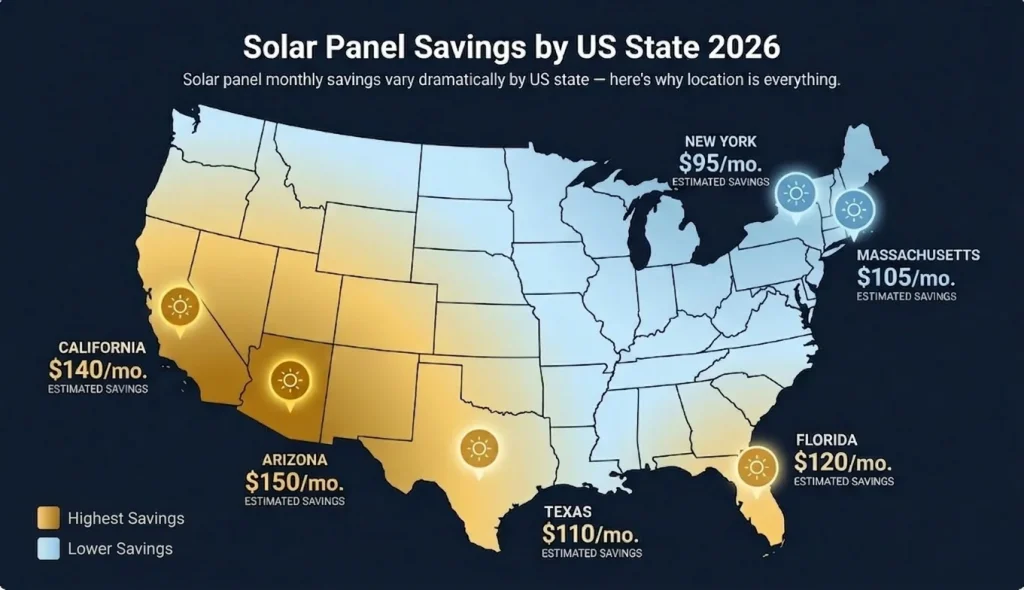
Solar Panel Savings by US State — Real 2026 Data
State-by-state, solar savings vary more than most people expect. The two driving variables are electricity rate (cents per kWh) and peak sun hours (how much solar generation your panels actually produce). High-rate states with good sun hours — like California, Hawaii, and Massachusetts — deliver exceptional returns. Lower-rate states with abundant sun — like Texas and Nevada — still deliver solid savings, just at a lower rate per kWh offset.
| State | Avg. Rate | Peak Sun Hrs | Monthly Savings | Annual Savings | 25-Year Savings |
| Hawaii | 42¢/kWh | 5.7 hrs | $280–$340/mo | $3,360–$4,080/yr | $84,000–$102,000 |
| California | 28¢/kWh | 5.8 hrs | $180–$230/mo | $2,160–$2,760/yr | $54,000–$69,000 |
| Massachusetts | 26¢/kWh | 4.3 hrs | $170–$210/mo | $2,040–$2,520/yr | $51,000–$63,000 |
| New York | 24¢/kWh | 4.5 hrs | $155–$195/mo | $1,860–$2,340/yr | $46,500–$58,500 |
| Arizona | 13¢/kWh | 6.5 hrs | $155–$200/mo | $1,860–$2,400/yr | $46,500–$60,000 |
| Florida | 13¢/kWh | 5.3 hrs | $145–$185/mo | $1,740–$2,220/yr | $43,500–$55,500 |
| Texas | 13¢/kWh | 5.5 hrs | $135–$175/mo | $1,620–$2,100/yr | $40,500–$52,500 |
| Colorado | 14¢/kWh | 5.0 hrs | $135–$170/mo | $1,620–$2,040/yr | $40,500–$51,000 |
| New Jersey | 17¢/kWh | 4.6 hrs | $140–$180/mo | $1,680–$2,160/yr | $42,000–$54,000 |
| Georgia | 12¢/kWh | 5.0 hrs | $115–$150/mo | $1,380–$1,800/yr | $34,500–$45,000 |
| Illinois | 13¢/kWh | 4.3 hrs | $105–$140/mo | $1,260–$1,680/yr | $31,500–$42,000 |
| Louisiana | 9¢/kWh | 5.0 hrs | $80–$110/mo | $960–$1,320/yr | $24,000–$33,000 |
Note: figures assume a correctly sized system covering approximately 90% of household electricity usage. Actual savings depend on system size, roof orientation, shading, net metering policy, and exact electricity rate. Use our calculator for your specific home.
📊 EnergySage: EnergySage Solar Marketplace — State-by-State Solar Savings Data 2026
Why Do Solar Savings Vary So Much Between States?
Two homeowners with the same size solar system can have annual savings that differ by more than $2,000 per year. Here is exactly why that happens — and which variable matters most.
Your Electricity Rate Is the Biggest Factor
The more you pay per kilowatt-hour, the more valuable each unit of solar electricity you generate. Consider two homeowners with identical 8kW systems producing 10,000 kWh per year:
| Homeowner | Electricity Rate | Annual Savings from Solar |
| Hawaii homeowner | 42¢/kWh | $4,200/year |
| California homeowner | 28¢/kWh | $2,800/year |
| Texas homeowner | 13¢/kWh | $1,300/year |
| Louisiana homeowner | 9¢/kWh | $900/year |
Same system. Same sun hours. Same electricity generated. But the Hawaii homeowner saves $3,300 more per year than the Louisiana homeowner — purely because of the electricity rate. This is why Hawaii, California, and the UK consistently show the strongest solar ROI despite having very different sun hours.
Peak Sun Hours Determine How Much Your System Generates
Peak sun hours measure the hours of sufficient sunlight intensity for optimal panel output each day. They directly determine how much electricity your system produces — and therefore how much you save.
- 6.5 peak sun hours/day (Arizona) × 8kW system × 365 days × 80% efficiency = ~15,184 kWh/year
- 2.8 peak sun hours/day (UK average) × 8kW system × 365 days × 80% efficiency = ~6,541 kWh/year
That is more than twice the generation — and twice the savings — for the same physical system, simply because of location. High electricity rates can compensate for lower sun hours (as the UK example shows — lower generation but higher value per kWh), but peak sun hours remain a critical variable.
Net Metering Policy Affects Your Return on Excess Generation
When your solar panels produce more electricity than your home needs — during midday and peak sunshine hours — the surplus flows to the grid. In states with strong net metering (California, New Jersey, Massachusetts), your utility credits you at or close to the full retail rate for this export. In states with reduced export compensation (Nevada, Florida after certain thresholds), you receive significantly less.
The difference between full retail net metering and reduced export compensation can add or subtract $200–$600 per year from your savings. Check your utility’s current net metering policy before finalising your savings estimate.
Solar Panel Savings by Country — International Data 2026
Solar savings outside the US vary enormously — driven by electricity rates, government incentives, and available sun hours. Here is the international picture for 2026:
| Country | Avg. Rate/kWh | Peak Sun Hrs | Monthly Savings | Annual Savings | Payback Period |
| Australia (avg) | 30¢ AUD | 5.3 hrs | AUD $190–$240/mo | AUD $2,280–$2,880/yr | 4–6 years |
| United Kingdom | 34p (~43¢) | 2.8 hrs | £80–£110/mo | £960–£1,320/yr | 10–13 years |
| Germany | 31¢ EUR | 3.5 hrs | €100–€130/mo | €1,200–€1,560/yr | 8–11 years |
| Spain | 29¢ EUR | 5.2 hrs | €130–€165/mo | €1,560–€1,980/yr | 5–7 years |
| Netherlands | 32¢ EUR | 2.7 hrs | €100–€130/mo | €1,200–€1,560/yr | 8–11 years |
| Canada (avg) | 13¢ CAD | 4.0 hrs | CA$100–$135/mo | CA$1,200–$1,620/yr | 10–13 years |
| UAE | 8¢ AED eq | 6.0 hrs | AED 480–580/mo | AED 5,760–6,960/yr | 5–7 years |
| India (avg) | 7¢ USD eq | 5.5 hrs | ₹2,400–3,200/mo | ₹28,800–38,400/yr | 6–9 years |
Australia stands out for its exceptional combination of high electricity rates, strong sun hours, and generous government STC rebates — producing some of the fastest solar payback periods in the world. The UK has lower generation due to fewer sun hours, but very high electricity rates (34p/kWh) partially compensate.
📊 Solar Choice: Solar Choice Australia — Average Solar Savings and Payback Data 2026
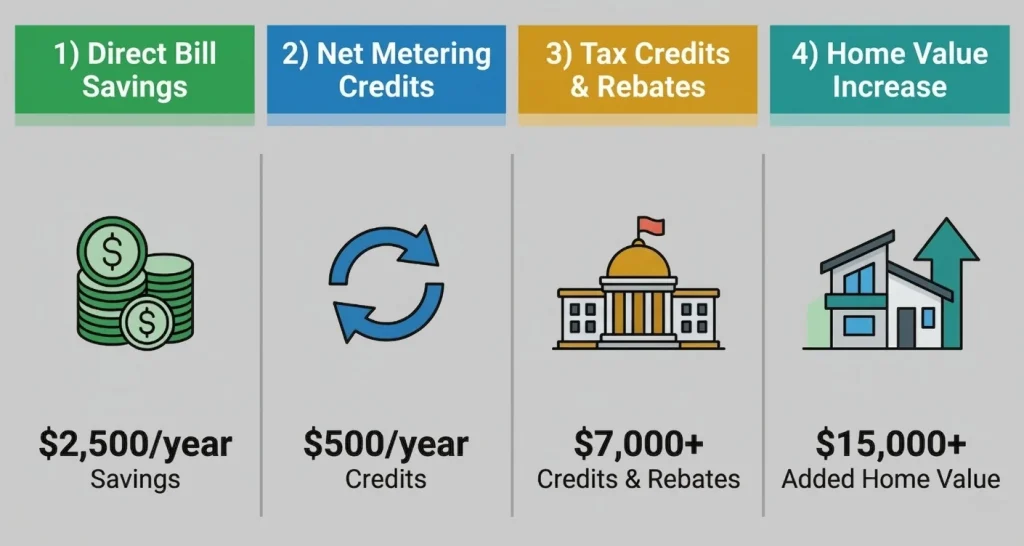
The 4 Ways Solar Panels Save You Money — A Full Breakdown
Most people focus only on the reduction in their electricity bill — but that is just one of four ways solar panels save you money. Understanding all four gives you a much more complete picture of the total financial return.
1. Direct Electricity Bill Savings — Your Biggest Saving
Every kilowatt-hour your solar panels generate is one you do not buy from the grid. This is the most immediate and visible saving — you see it on your first electricity bill after installation. For a correctly sized system covering 80–100% of your usage, this alone accounts for $1,200 to $3,000+ per year depending on your location and electricity rate.
The saving compounds over time because grid electricity prices rise by an average of 3–5% per year, while your solar system’s cost is fixed at installation. By year 10, the same panels generating the same electricity are worth significantly more in savings terms than they were on day one.
2. Net Metering Credits — Getting Paid for Surplus Generation
During peak sunshine hours — typically mid-morning to mid-afternoon — most home solar systems generate more electricity than the household is actually using. That surplus flows into the grid, and your utility credits your account. In strong net metering states (California, New Jersey, Massachusetts), these credits are applied at the full retail rate, effectively running your meter backwards.
For a typical 8kW system, net metering credits add $200 to $600 per year to your total savings, depending on your consumption pattern, system size, and local metering policy.
3. Government Tax Credits and Rebates — Reducing Your Net Cost
While not a recurring annual saving, the 30% US federal ITC is a one-time reduction in your net installation cost that dramatically improves your overall return. On a $22,000 system, the $6,600 federal credit reduces your payback period by roughly 2–3 years — which means you reach the profit phase of your solar investment that much sooner.
State-level rebates, SREC income (in New Jersey, Massachusetts, Maryland), and Australian STC rebates are additional financial benefits that solar tax credit calculator 2026 factors into your personalised estimate.
4. Increased Home Value — The Long-Term Equity Benefit
Multiple studies — including the widely cited Lawrence Berkeley National Laboratory research — show that solar panels increase home resale value by an average of 3–4% in the US. For a $400,000 home, that represents $12,000 to $16,000 in added equity. While this is not a cash saving in the traditional sense, it is a real financial gain that matters if you sell your home before reaching the payback period on your electricity savings alone. Read more about Solar Panel Saving.
How to Calculate Your Own Solar Savings in 3 Steps
You do not need to be an engineer to work out a solid estimate of your solar savings. Here is the straightforward three-step method:
Step 1 — Calculate Your Annual Electricity Consumption
Find your monthly electricity bill and look for your consumption in kWh (not just the dollar amount). Multiply by 12 for your annual usage. The US national average is about 10,800 kWh per year — but your actual usage may be significantly higher or lower depending on your home size, climate, and appliances.
Example: If your bill shows 900 kWh/month × 12 = 10,800 kWh/year.
Step 2 — Multiply by Your Electricity Rate
Take your annual consumption in kWh and multiply by your electricity rate in $/kWh. This gives you your current annual electricity spend — which is roughly the upper limit of what solar can save you if it covers 100% of your usage.
Example: 10,800 kWh × $0.16/kWh = $1,728 per year in electricity costs. A correctly sized system covering 90% of this would save approximately $1,555 per year.
Step 3 — Use a Calculator for Precision
The above gives you a ballpark figure. For a personalised estimate that accounts for your roof orientation, local sun hours, net metering policy, available incentives, and system cost. It takes under two minutes and uses NREL irradiance data for your exact location.
Solar Savings by Household Size — What to Expect
Your monthly electricity bill is the fastest proxy for your solar savings potential. Here is what homeowners at different usage levels typically save in a mid-range US market (average rate of 16¢/kWh, 4.5 peak sun hours):
| Monthly Bill | System Size Needed | Monthly Savings | Annual Savings | Payback Period |
| $60–$80/month | 3–4 kW | $50–$70/mo | $600–$840/yr | 12–16 years |
| $80–$120/month | 4–6 kW | $70–$105/mo | $840–$1,260/yr | 9–13 years |
| $120–$180/month | 6–9 kW | $105–$160/mo | $1,260–$1,920/yr | 7–10 years |
| $180–$250/month | 9–12 kW | $160–$220/mo | $1,920–$2,640/yr | 6–8 years |
| $250–$350/month | 12–17 kW | $220–$310/mo | $2,640–$3,720/yr | 5–7 years |
| $350+/month | 17 kW+ | $310+/mo | $3,720+/yr | 4–6 years |
The pattern is clear: higher electricity bills mean proportionally larger savings and faster payback periods. If your monthly bill is below $80, solar is a marginal investment in most markets. Above $150, the financial case becomes compelling.
📊 DOE: U.S. Department of Energy — Residential Energy Consumption and Solar Savings Data
How Much Do Solar Panels Save Over 25 Years?
The most compelling solar savings number is the 25-year lifetime figure — because solar panels are warrantied for 25 years of performance and typically last 30 years or more with minimal degradation (around 0.5% output reduction per year).
Here is what the 25-year savings picture looks like across different scenarios, assuming 3% annual electricity price increases — a conservative estimate given recent trends:
| Scenario | Net System Cost | Year 1 Savings | Payback | 25-Year Net Savings |
| Arizona — high bill | $15,680 | $2,520/yr | 6.2 yrs | $78,000 |
| California — avg | $18,480 | $2,280/yr | 7.9 yrs | $57,000 |
| Florida — avg | $16,240 | $2,040/yr | 7.9 yrs | $51,000 |
| New York — avg | $19,600 | $2,160/yr | 9.1 yrs | $54,000 |
| Texas — avg | $15,960 | $1,980/yr | 8.1 yrs | $49,500 |
| UK — avg | £14,400 | £1,140/yr | 12.6 yrs | £18,500 |
| Australia — avg | AUD $6,200 | AUD $2,640/yr | 4.6 yrs | AUD $82,000 |
Australia’s exceptional figures reflect its combination of high electricity rates, abundant sun, and large STC rebates that bring the net installation cost dramatically below the US or UK equivalent. The US figures assume the 30% federal ITC applied.
Frequently Asked Questions
How much do solar panels save on electricity bills per month?
The average US homeowner with solar panels saves $125 to $167 per month on their electricity bill. The range is broad: homeowners in high-rate states like Hawaii and California typically save $200 to $340 per month, while those in lower-rate states like Louisiana or Arkansas may save $70 to $110 per month with the same size system. Your electricity rate is the single biggest factor in your monthly savings.
Do solar panels completely eliminate your electricity bill?
A correctly sized solar system can reduce your electricity bill to near zero in many months — particularly in spring and summer when generation peaks. However, most grid-tied systems still draw some power at night or during overcast periods. Net metering credits from excess daytime generation often offset nighttime grid usage, resulting in a bill of $10 to $30 per month for basic connection charges. Complete bill elimination typically requires battery storage alongside solar panels.
How long before solar panels pay for themselves?
The average US solar payback period in 2026 is 7 to 9 years, after the 30% federal tax credit. In high-sun, high-rate states like Arizona, California, and Hawaii, payback periods of 5 to 7 years are common. In lower-rate states or regions with less sun, payback can extend to 11 to 14 years. Australia has some of the shortest payback periods in the world at 4 to 6 years.
Does solar save more money when electricity prices rise?
Yes — and this is one of the most important financial arguments for solar. Every cent increase in your electricity rate makes each solar kilowatt-hour more valuable. With grid electricity prices having risen 30 to 60 percent in most markets since 2020, homeowners who installed solar in 2021 or 2022 are saving significantly more per year now than their original estimates projected. Locking in solar generation now protects you against future electricity price increases.