
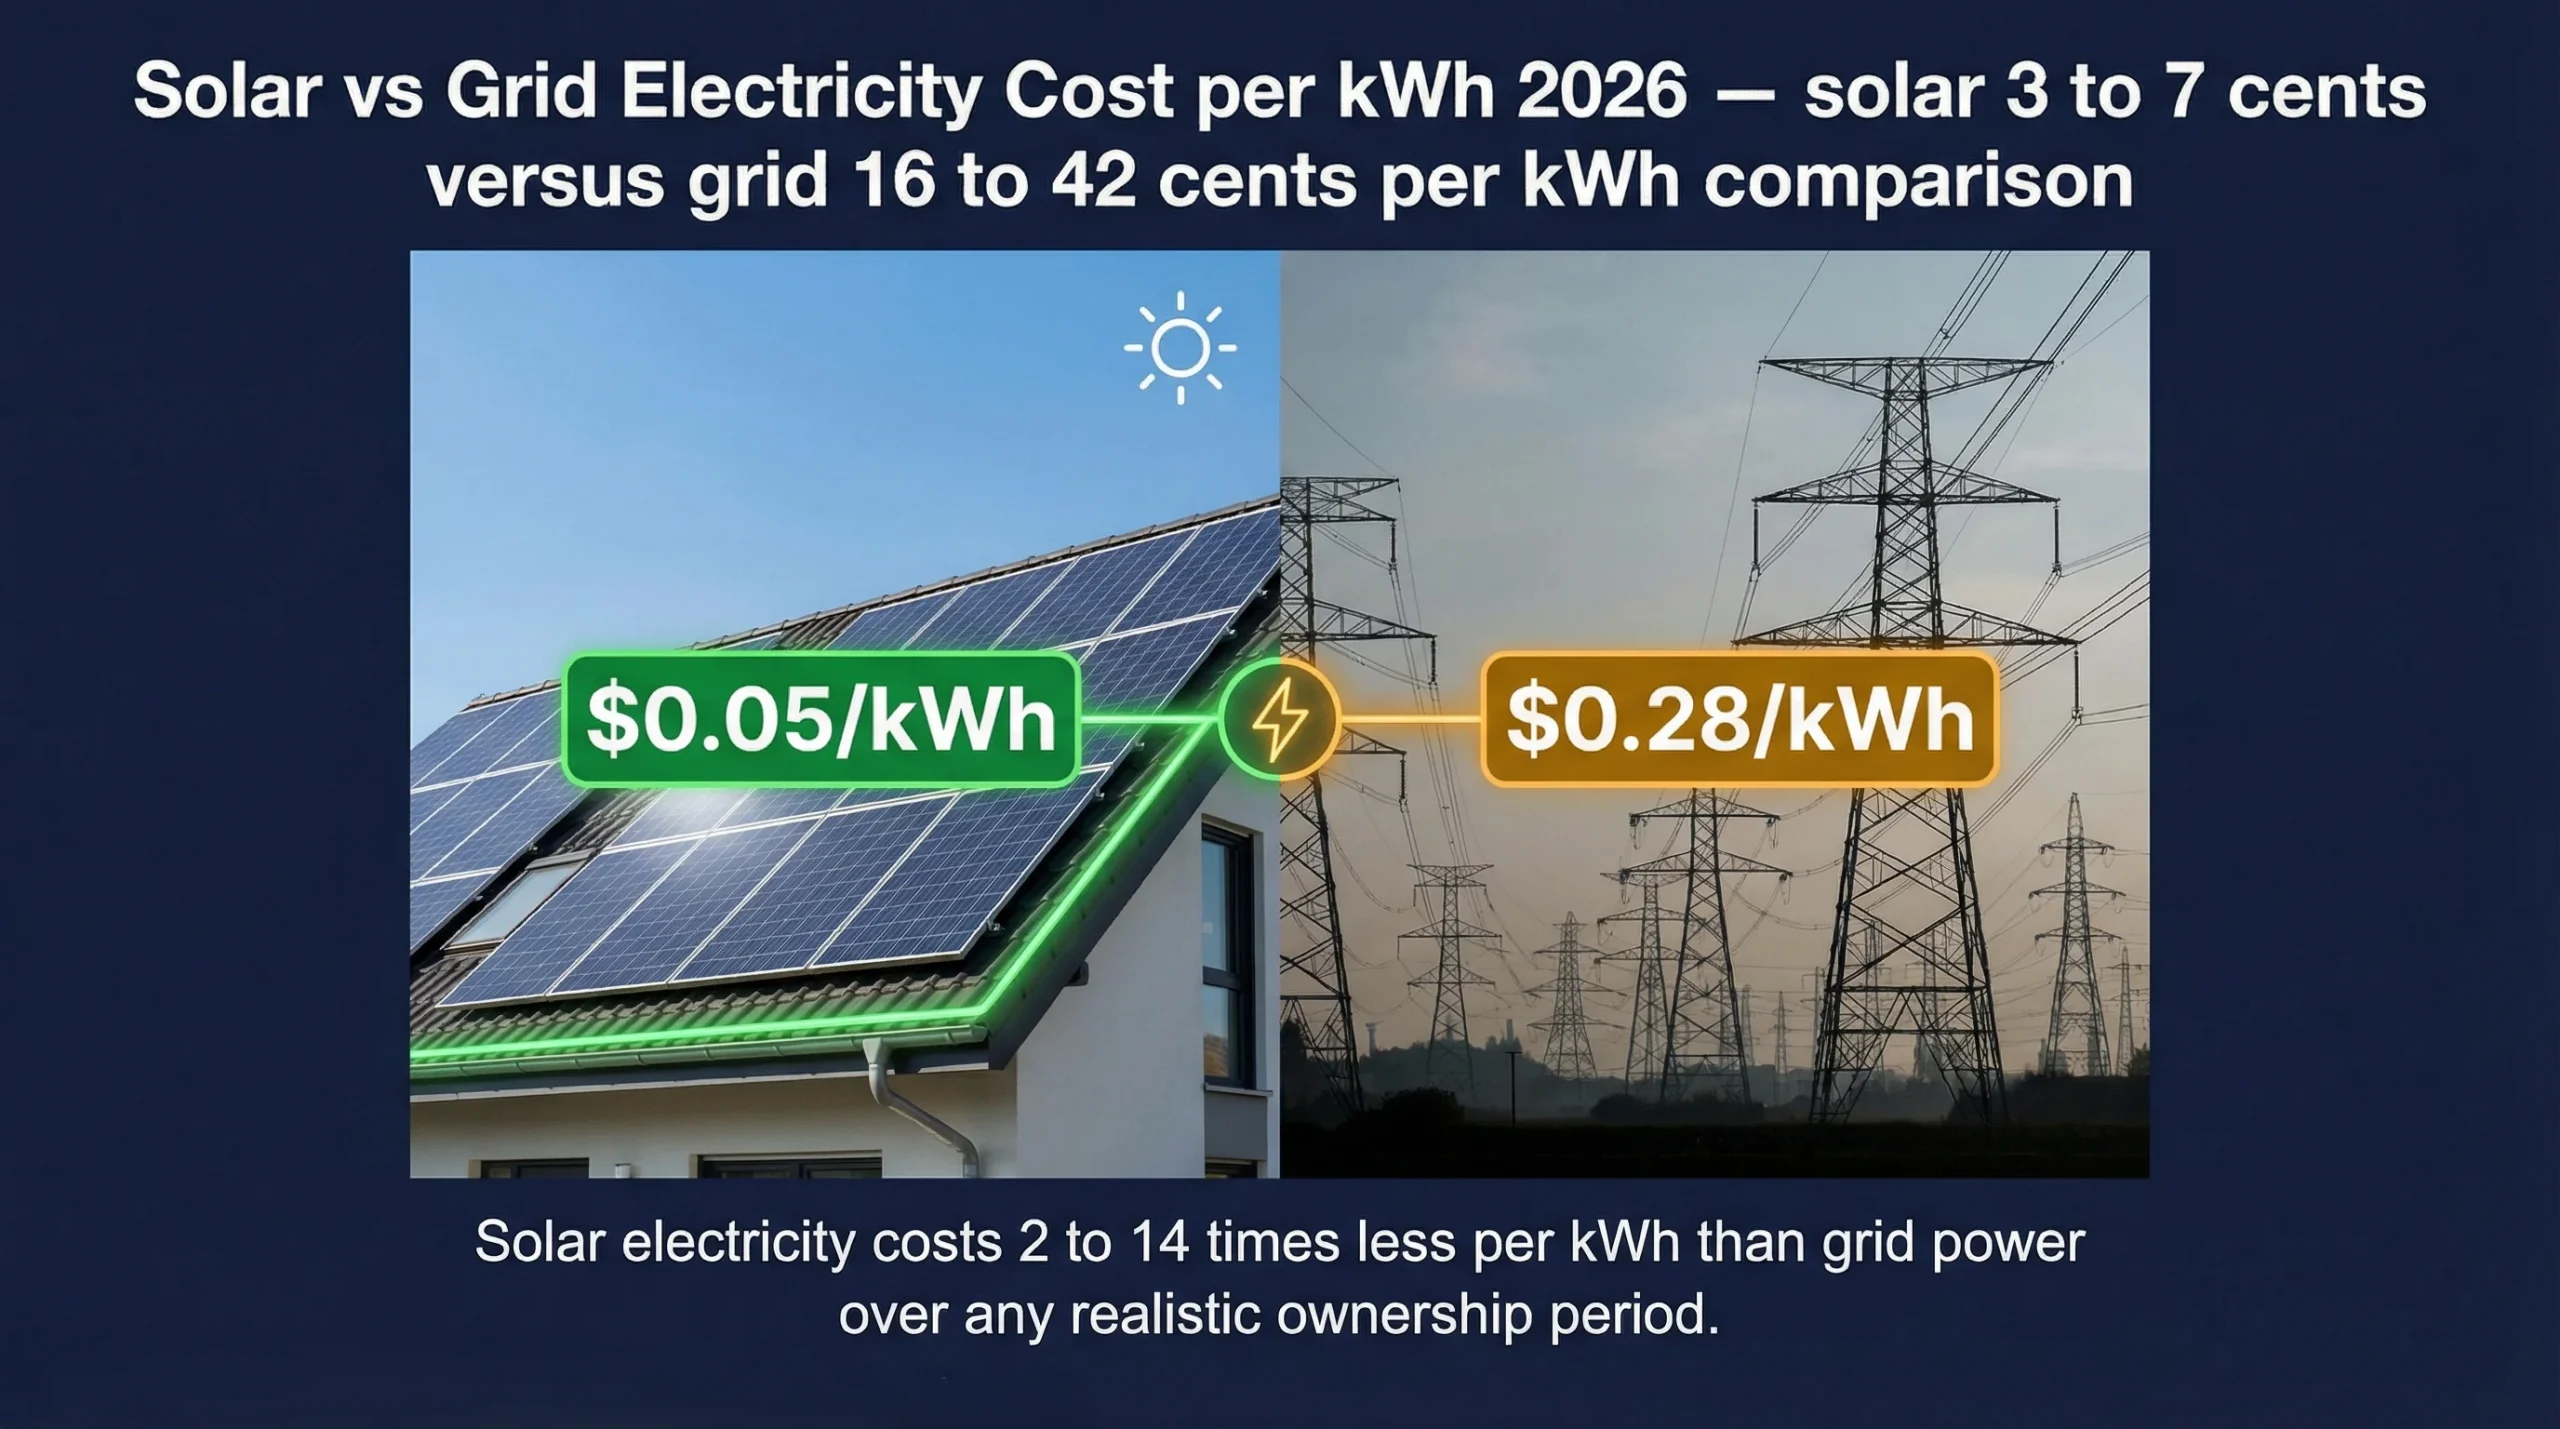
The most fundamental question in residential solar has a clear answer in 2026: solar electricity is significantly cheaper than grid electricity — in every US state, over any realistic ownership period. The margin ranges from 2x cheaper in the lowest-rate states to 14x cheaper in Hawaii. Understanding the numbers behind this comparison is the foundation of any sound solar decision.
Cash-purchased solar generates electricity at approximately $0.04 to $0.06 per kWh over a 25-year system life. The US national average grid rate is $0.162 per kWh in 2026 — and it has been rising at 3 to 5% per year for the past decade. Even loan-financed solar costs $0.06 to $0.09 per kWh — less than half the current grid rate. By year 20, when grid rates will have risen to $0.28 to $0.38/kWh at historical inflation rates, your locked-in solar electricity will still cost the same $0.04 to $0.09 per kWh it cost when you installed.
The Cost Comparison in One Number:
| Cash-purchased solar electricity costs $0.04 to $0.06 per kWh over 25 years. The US average grid rate today is $0.16/kWh and will reach approximately $0.38/kWh by 2051 at historical inflation rates. Solar electricity is 50 to 85% cheaper than grid power in average US markets — and the advantage widens every single year as grid prices rise while solar costs stay fixed. |
📌 Also Read:
| → Are Solar Panels Worth It in 2026? Full Financial Analysis → How Much Do Solar Panels Save? State-by-State Data → How Long to Pay Off Solar Panels? |
How to Calculate Solar’s True Cost Per kWh
The cost per kWh of your solar electricity = Net system cost ÷ Total lifetime generation. A cash-purchased 8kW system with a net cost of $15,680 after the 30% ITC generates approximately 260,000 kWh over 25 years: $15,680 ÷ 260,000 = $0.060 per kWh. That compares to the current US average grid rate of $0.162 — meaning solar is 63% cheaper today, and the gap widens every year as grid rates rise while solar costs stay fixed.
| State | 2026 Grid Rate | Solar LCOE Cash | Solar LCOE Loan | Solar Advantage |
| Hawaii | 42¢/kWh | $0.05/kWh | $0.08/kWh | Solar 81–88% cheaper |
| California | 28¢/kWh | $0.06/kWh | $0.09/kWh | Solar 68–79% cheaper |
| Massachusetts | 26¢/kWh | $0.06/kWh | $0.09/kWh | Solar 65–77% cheaper |
| New York | 24¢/kWh | $0.06/kWh | $0.09/kWh | Solar 63–75% cheaper |
| Arizona | 13¢/kWh | $0.04/kWh | $0.06/kWh | Solar 54–69% cheaper |
| Florida | 13¢/kWh | $0.05/kWh | $0.07/kWh | Solar 54–65% cheaper |
| Texas | 13¢/kWh | $0.04/kWh | $0.06/kWh | Solar 54–69% cheaper |
| US Average | 16¢/kWh | $0.05/kWh | $0.07/kWh | Solar 56–69% cheaper |
| Louisiana | 9¢/kWh | $0.04/kWh | $0.07/kWh | Solar 22–56% cheaper |
📊 EIA: US Retail Electricity Prices by State 2026
Grid Electricity Prices Are Rising — Solar Costs Are Locked In
US electricity retail rates rose 56% between 2016 and 2026. At a conservative 3.5% annual increase going forward, the average US grid rate will reach:
- 2031 (Year 5): 19¢/kWh — solar is already 3× to 4× cheaper
- 2036 (Year 10): 23¢/kWh — loan paid off, full savings now begin
- 2041 (Year 15): 27¢/kWh — solar homeowner has recouped full investment many times over
- 2046 (Year 20): 32¢/kWh — solar electricity still costs $0.05–$0.09/kWh
- 2051 (Year 25): 38¢/kWh — solar electricity is 6× to 10× cheaper than the grid
This compounding advantage is why the long-term financial case for solar strengthens every year. The homeowner who installed in 2016 at a 10¢/kWh grid rate is now saving at 16¢/kWh — 60% more value per kWh than originally projected. By 2031 they will be saving at 19¢/kWh — essentially doubling the original financial case without doing anything.
The Comparison by Financing Method
| Financing | Total Cost (8kW) | Lifetime kWh | Effective $/kWh | vs Grid (avg 25yr) |
| Cash purchase (after ITC) | $15,680 | 260,000 | $0.060/kWh | 75% cheaper |
| Solar loan 10yr, 5.99% | $19,800 | 260,000 | $0.076/kWh | 68% cheaper |
| Solar loan 15yr, 4.99% | $22,100 | 260,000 | $0.085/kWh | 65% cheaper |
| Solar lease (20yr, 2% escalator) | ~$32,000 | N/A — not owned | ~$0.12/kWh equiv. | 51% cheaper |
| Grid electricity (25yr avg, 3.5% growth) | ~$62,000 | N/A | $0.238/kWh avg | Baseline |
📌 Also Read:
| → How Much Do Solar Panels Cost Per Month? All Finance Options → Solar Tax Credit 2026 — Cut Net System Cost by 30% → How Much Do Solar Panels Save? |
Frequently Asked Questions
Is solar electricity cheaper than grid electricity right now in 2026?
On a cost-per-kWh basis over the system’s lifetime, yes — significantly. Cash-purchased solar costs $0.04 to $0.06/kWh over 25 years compared to $0.16 average grid rate today. Even in the first year, the effective cost of solar electricity (amortised installation cost) is below grid rates in all US states above 9¢/kWh. The comparison improves dramatically every subsequent year as grid prices rise.
Does solar electricity become cheaper than grid from day one?
In monthly cash-flow terms, solar is often cash-flow positive from day one in high-rate states (CA, HI, MA, NY) where monthly savings exceed the loan payment. In average US markets, month-one savings and loan payments are roughly equal — neutral from day one. The dramatic cost advantage accumulates over time, accelerating sharply after the loan payoff date when savings continue with no payment offset.
How does rising grid price change the solar comparison?
Every 1¢ increase in the grid rate makes each solar kWh worth 1¢ more. At 3.5% annual rate growth, the grid rate doubles approximately every 20 years. Your solar electricity cost stays flat. A homeowner who installed at $0.13/kWh grid rate in 2015 is now saving at $0.16/kWh — 23% more value per kWh than projected. By 2035, the same panels will be producing electricity worth $0.22/kWh at current trajectory. This compounding effect is the core long-term argument for solar.
Is solar cheaper per kWh than grid in every US state?
Over any 25-year period, yes — in every US state. The margin varies: in Hawaii, cash solar ($0.05/kWh) vs grid (42¢) means solar is nearly 9× cheaper over 25 years. In Louisiana ($0.09/kWh grid), solar ($0.04/kWh) is still 2× cheaper over 25 years at current rates, improving to 3× or more as Louisiana rates rise. The question is not whether solar is cheaper per kWh — it is — but whether the upfront investment suits your financial position and tenure.