
When my colleague asked me ‘how much do solar panels cost per month?’, I realised she was asking two completely different questions at the same time — and most solar articles only answer one of them.
The first interpretation: what is the monthly payment if I finance solar with a loan? That is a straightforward maths question — take the net cost, apply an interest rate and term, and you get a number. For a typical 8kW system financed over 10 years at 5.99%, that payment is approximately $147 per month.
The second interpretation: what does solar actually cost me net each month, after my electricity bill savings offset the payment? That number is very different — and often surprisingly positive. If that same $147/month loan payment replaces a $155 electricity bill, the net monthly cost of going solar is negative $8. You are cash-flow positive from day one.
This guide answers both questions fully — covering solar loan payments, lease costs, PPA rates, cash purchase amortisation, and the all-important net monthly figure that tells you what solar actually does to your monthly outgoings.
The Key Distinction:
| There are two different ‘monthly cost’ questions for solar. The gross monthly payment (loan, lease, or PPA) is what you pay the finance company. The net monthly cost is what solar actually adds to your outgoings after your electricity savings are factored in. For most homeowners with a $120+ electricity bill in a mid-range US market, the net monthly cost of a solar loan is near zero or positive from the first payment. |
📊 NREL: National Renewable Energy Laboratory — Residential Solar Financing Options and Cost Data 2026
📌 Also Read:
How Much Do Solar Panels Cost Per Month? The Four Scenarios
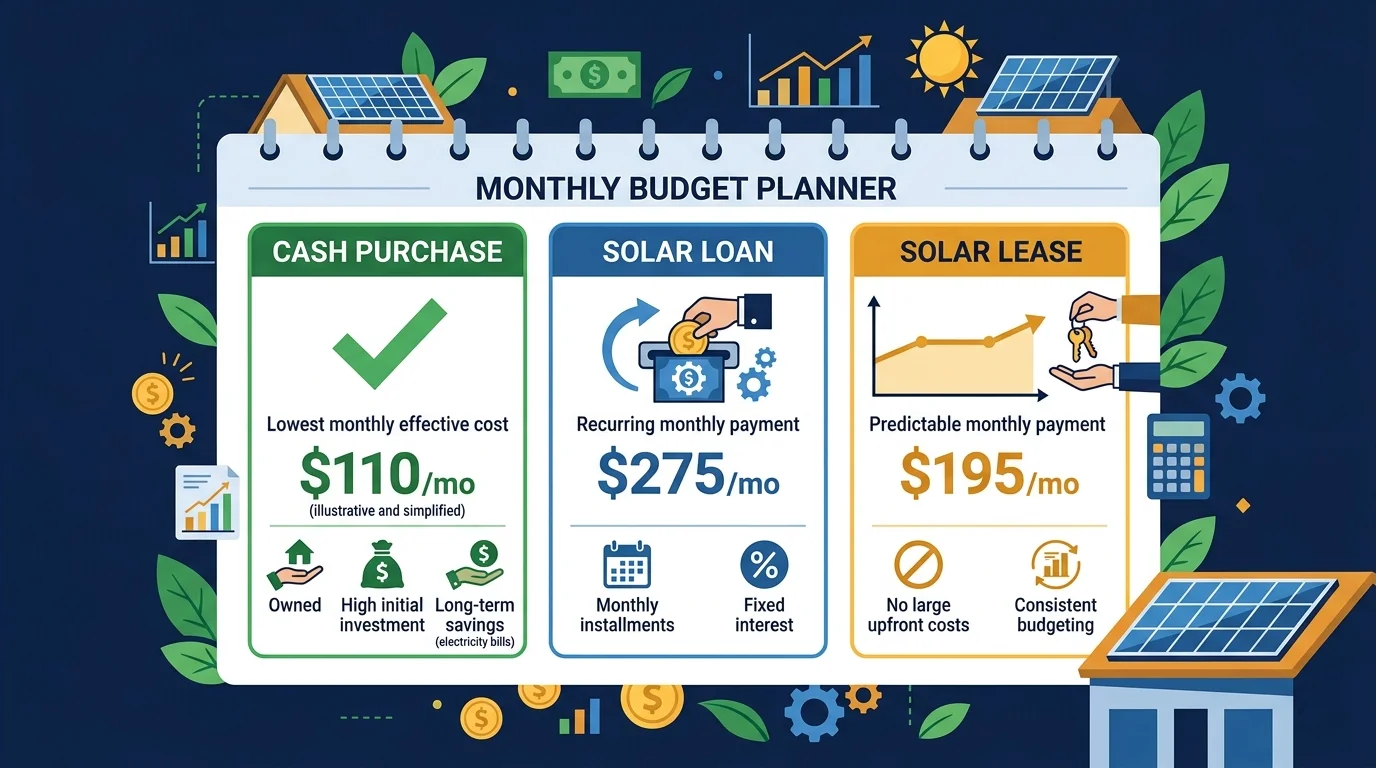
The monthly cost of solar panels depends entirely on how you pay for them. There are four distinct payment models — cash purchase, solar loan, solar lease, and power purchase agreement (PPA) — and each produces a completely different monthly figure and long-term financial outcome.
| $0/mo | $100–$200/mo | $80–$150/mo | 9–12¢/kWh |
| Cash purchase — no monthly payment | Solar loan payment (avg US 8kW) | Solar lease monthly cost | Typical PPA rate 2026 |
Before looking at each option in detail, here is the key framing: the monthly cost of solar is only meaningful when compared to your current monthly electricity bill. A $147/month solar loan payment on a system that eliminates a $170 electricity bill leaves you $23 per month better off from day one — before tax credits, before payback, before any return calculation.
Solar Loan Monthly Payments — Real Figures for 2026
A solar loan is the most popular financing method for US homeowners who want to own their system without paying cash upfront. You borrow the net cost of the system (after the 30% federal ITC credit is factored in by many lenders), pay monthly instalments, and own the system outright from day one — entitling you to all tax credits, net metering income, and long-term savings.
How Solar Loan Monthly Payments Are Calculated
Your monthly solar loan payment is determined by three variables: the loan principal (your net system cost), the interest rate, and the loan term. In 2026, solar loan rates range from 4.99% to 9.99% APR depending on your credit score and lender. Terms of 10, 12, or 15 years are most common.
| Net System Cost | Interest Rate | Loan Term | Monthly Payment | Total Interest Paid | Total Cost |
| $12,000 | 4.99% | 10 yrs | $127/mo | $3,240 | $15,240 |
| $12,000 | 6.99% | 10 yrs | $139/mo | $4,680 | $16,680 |
| $15,600 | 4.99% | 10 yrs | $165/mo | $4,200 | $19,800 |
| $15,600 | 6.99% | 10 yrs | $181/mo | $6,120 | $21,720 |
| $15,600 | 4.99% | 15 yrs | $123/mo | $6,540 | $22,140 |
| $19,000 | 4.99% | 10 yrs | $202/mo | $5,240 | $24,240 |
| $19,000 | 6.99% | 12 yrs | $198/mo | $8,448 | $27,448 |
| $19,000 | 4.99% | 15 yrs | $150/mo | $8,000 | $27,000 |
The most important observation from this table: every row shows a monthly payment that is lower than a typical household electricity bill in moderate or high-rate states. If your bill exceeds $150/month, a 10-year solar loan in most scenarios will be cash-flow neutral or positive from the first payment — before the loan is even paid off.
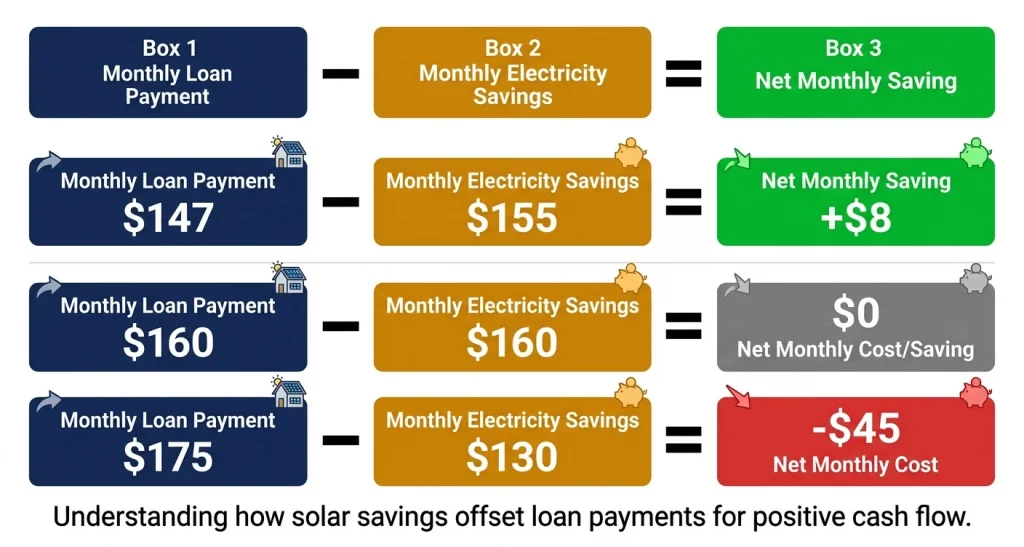
Net Monthly Cost — Loan Payment vs Electricity Savings
The number that most solar articles fail to show clearly is the net monthly position — what you actually pay out extra versus what you save on your electricity bill. Here is the comparison for a standard 8kW system in an average US market:
| Scenario | Monthly Loan Payment | Monthly Electricity Saving | Net Monthly Position | Verdict |
| Arizona, $220 bill, 6.99% 10yr | $181/mo | $200/mo | −$19/mo (saving) | ✅ Cash positive day 1 |
| California, $190 bill, 5.99% 10yr | $165/mo | $175/mo | −$10/mo (saving) | ✅ Cash positive day 1 |
| Texas, $160 bill, 5.99% 10yr | $165/mo | $145/mo | +$20/mo extra | ✅ Near neutral day 1 |
| New York, $185 bill, 5.99% 10yr | $181/mo | $165/mo | +$16/mo extra | ✅ Near neutral, strong after payoff |
| Louisiana, $110 bill, 6.99% 10yr | $127/mo | $95/mo | +$32/mo extra | ⚠️ Negative near term |
| Avg US, $150 bill, 5.99% 10yr | $155/mo | $135/mo | +$20/mo extra | ✅ Near neutral, great long term |
In high-rate markets — California, Arizona, Hawaii, Massachusetts — a well-structured solar loan is cash-flow positive from the first payment. In average US markets, the loan payment roughly matches the electricity saving in early years, improving significantly once the loan is paid off and the electricity savings continue for the remaining system life.
📊 EnergySage: EnergySage — Solar Loan vs Cash Purchase: Monthly Cost Comparison 2026
📌 Also Read:
Solar Lease Monthly Costs — What You Pay and What You Get
A solar lease allows you to use a solar system installed on your roof without owning it. You pay a fixed monthly lease fee to the solar company, which covers installation, maintenance, and monitoring. The solar company owns the panels, claims all tax credits, and earns net metering income — you simply pay the lease and enjoy lower (but not free) electricity.
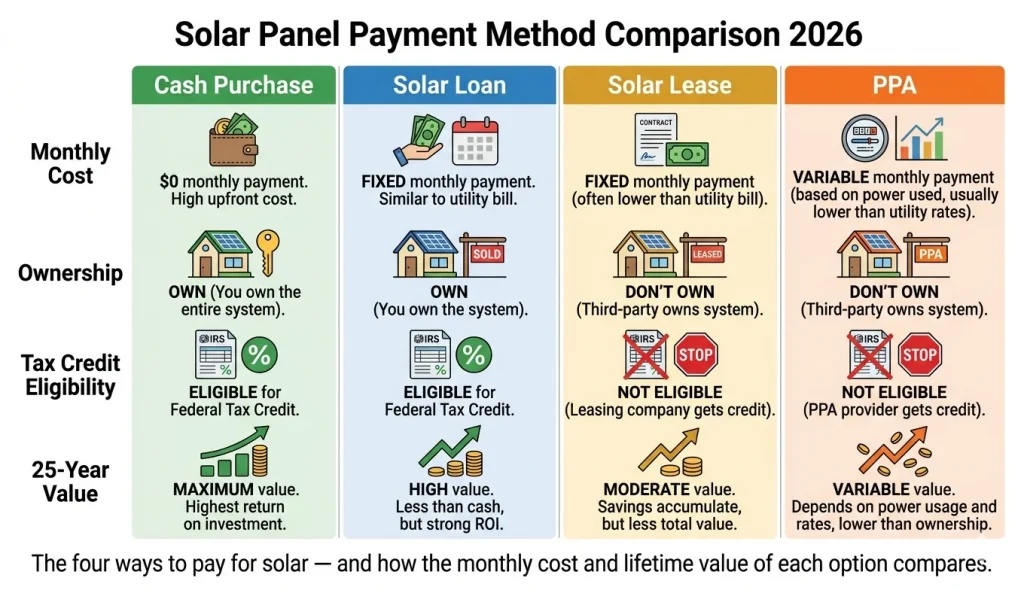
| Payment Method | Typical Monthly Cost | Do You Own? | Tax Credit? | Best For |
| Cash Purchase | $0/mo payment | Yes ✅ | Yes ✅ — full 30% | Maximum long-term return |
| Solar Loan | $100–$200/mo | Yes ✅ | Yes ✅ — full 30% | Best balance of cost and ownership |
| Solar Lease | $80–$150/mo | No ❌ | No ❌ | No upfront cost, low commitment |
| Power Purchase Agreement (PPA) | Based on kWh used (9–12¢) | No ❌ | No ❌ | Usage-based — predictable bills |
Solar Lease Typical Monthly Costs in 2026
Solar leases are priced based on system size, location, and the solar company’s cost of capital. In 2026, typical solar lease monthly payments run:
- 4 kW system lease: $65 to $90 per month
- 6 kW system lease: $90 to $125 per month
- 8 kW system lease: $110 to $155 per month
- 10 kW system lease: $130 to $185 per month
Most solar leases include annual escalator clauses of 1.5 to 3% per year — meaning your monthly lease payment increases each year by a fixed percentage. Over a 20-year lease term, a lease that starts at $115/month with a 2.5% annual escalator becomes $193/month in year 20. This escalator is typically still below projected electricity price increases — but it is an important factor to understand before signing.
Why Solar Loans Beat Leases for Most Homeowners
For most homeowners who can qualify for a solar loan, a loan is significantly more financially advantageous than a lease:
- You own the system and can claim the full 30% federal tax credit — potentially saving $5,000 to $9,000
- You keep all net metering income and electricity savings, not a portion
- The system increases your home’s resale value; a leased system complicates home sales
- After the loan is paid off, your electricity is free — a lease payment continues for 20 years
- Loan payments are fixed; lease payments increase annually
The only scenario where a lease may be preferable is if you have a low credit score that prevents access to good loan rates, or if you value zero maintenance responsibility above all other financial considerations.
Power Purchase Agreement (PPA) — Monthly Cost Structure
A PPA is similar to a lease in that you do not own the panels, but instead of a fixed monthly fee, you pay per kilowatt-hour of electricity your panels produce — typically at a rate of 9 to 12¢/kWh in 2026. This is usually below your utility rate, creating immediate savings without ownership.
| System Size | Monthly Generation (avg US) | PPA Rate (10¢/kWh) | Monthly PPA Cost |
| 5 kW | ~550 kWh/mo | 10¢/kWh | $55/mo |
| 7 kW | ~770 kWh/mo | 10¢/kWh | $77/mo |
| 8 kW | ~876 kWh/mo | 10¢/kWh | $88/mo |
| 10 kW | ~1,095 kWh/mo | 10¢/kWh | $110/mo |
PPAs look attractive on paper but share the same fundamental limitation as leases: you do not own the system, cannot claim the tax credit, and the PPA rate typically escalates 1 to 3% per year. The main advantage of a PPA over a lease is that your payment only occurs when the system generates electricity — in a poor generation month, you pay less.
📊 DOE: U.S. Department of Energy — Solar Financing Options: Loans, Leases, and PPAs Compared
Cash Purchase — The True Monthly Cost
If you pay cash for solar panels, your monthly ‘payment’ is technically zero — there is no loan or lease invoice. But a cash purchase is still a financial commitment, and understanding its effective monthly cost helps you compare it fairly to financed options.
The effective monthly cost of a cash purchase is calculated by amortising the net investment cost over the system’s warrantied life:
| Net System Cost (after ITC) | Amortised Over | Effective Monthly Cost | Monthly Savings (avg US) |
| $10,000 | 25 years | $33/mo | $125–$167/mo |
| $13,000 | 25 years | $43/mo | $125–$167/mo |
| $16,000 | 25 years | $53/mo | $125–$167/mo |
| $19,000 | 25 years | $63/mo | $125–$167/mo |
| $22,000 | 25 years | $73/mo | $125–$167/mo |
Even at the highest net cost tier, cash purchase amortised over the system’s 25-year life produces an effective monthly cost of $73 — against monthly electricity savings of $125 to $167 in average US markets. Cash purchase delivers the highest long-term financial return of any payment method, but requires access to $12,000 to $22,000+ in capital upfront.
The Net Monthly Cost — What Solar Actually Does to Your Budget
The most useful number for any homeowner evaluating solar is the net monthly impact on their budget — the difference between their monthly solar cost (payment or amortised cost) and their monthly electricity savings. Here is the complete picture across payment methods and market types:
| Payment Method | Typical Monthly Cost | Monthly Savings (avg US) | Net Monthly Position | After Loan Payoff / Lease End | 10-Year Net |
| Cash Purchase | $53/mo eff. | $147/mo | −$94/mo saving | Same — no payoff needed | −$11,280 saving |
| Solar Loan 10yr | $155/mo | $147/mo | $8/mo extra | −$147/mo saving (full savings) | −$9,240 saving |
| Solar Loan 15yr | $123/mo | $147/mo | −$24/mo saving | −$147/mo saving | −$2,880 saving |
| Solar Lease 20yr | $115/mo | $115/mo | $0 neutral | Lease continues | Neutral then restart |
| PPA | $88/mo | $130/mo | −$42/mo saving | PPA continues | −$5,040 saving |
The transformative moment for loan-financed solar is the loan payoff date — typically year 10 or year 12. At that point, your monthly solar payment disappears but your electricity savings continue for the remaining 13 to 15 years of the panel warranty. That post-payoff period is when the bulk of lifetime savings accumulates — and the monthly benefit becomes the full electricity saving with zero offset payment.
Solar Panel Monthly Cost by System Size — Quick Reference
Here is the complete quick-reference table for monthly solar loan payments at different system sizes, using the most common financing structure in 2026 (10-year term, 5.99% APR, 30% federal ITC applied to reduce principal):
| System Size | Gross Cost | After 30% ITC | Monthly Payment (5.99%, 10yr) | Monthly Payment (6.99%, 10yr) | Monthly Payment (4.99%, 15yr) | Avg. Monthly Saving |
| 4 kW | $12,000 | $8,400 | $93/mo | $97/mo | $66/mo | $80–$110/mo |
| 5 kW | $15,000 | $10,500 | $116/mo | $122/mo | $83/mo | $100–$140/mo |
| 6 kW | $18,000 | $12,600 | $140/mo | $147/mo | $99/mo | $120–$165/mo |
| 7 kW | $21,000 | $14,700 | $163/mo | $171/mo | $116/mo | $140–$190/mo |
| 8 kW | $24,000 | $16,800 | $186/mo | $196/mo | $133/mo | $160–$220/mo |
| 10 kW | $30,000 | $21,000 | $233/mo | $245/mo | $166/mo | $200–$275/mo |
| 12 kW | $36,000 | $25,200 | $280/mo | $294/mo | $199/mo | $240–$330/mo |
The average monthly saving column uses US average rates and sun hours. In high-rate states like California or Massachusetts, monthly savings will be 30 to 50% higher — making the net monthly position even more favourable from day one.
📊 CFPB: Consumer Financial Protection Bureau — Guide to Solar Financing Products and Homeowner Rights
5 Things to Check Before Signing Any Solar Monthly Payment Agreement
Whether you are signing a solar loan, lease, or PPA, these five checks protect you from the most common homeowner pitfalls in solar financing agreements.
1. Check the Annual Escalator Clause
Solar leases and PPAs almost always include an annual escalator — a fixed percentage increase in your monthly payment each year. Common escalators are 1.5%, 2%, or 2.9% per year. Over a 20-year term, a 2.9% escalator on a $100/month lease produces a payment of $176 in year 20. Always calculate what your payment will be in year 10 and year 20 before signing.
2. Understand the Early Termination Clause
Solar leases and PPAs typically lock you in for 20 years. If you need to exit early — due to a move, financial hardship, or system dissatisfaction — early termination fees can run $1,000 to $10,000 depending on the remaining term. Confirm the exact early termination cost before signing any long-term solar agreement.
3. Know Your Home Sale Obligations
A leased solar system must either be transferred to the new buyer (who must qualify and agree to the lease terms) or bought out at the time of sale. Buyout costs vary widely. Buyer resistance to assuming a solar lease is a documented issue in some US real estate markets. If you plan to sell within 7 years, a solar loan is generally safer than a lease.
4. Confirm What Maintenance Is Covered
Solar loan agreements provide no ongoing service coverage — maintenance is your responsibility as the owner. Leases and PPAs typically include maintenance, monitoring, and performance guarantees as part of the monthly payment. Confirm exactly what is covered before signing. Key items to check: panel replacement coverage, inverter warranty, monitoring system, and roof penetration warranty.
5. Verify Your Net Metering Rights Are Protected
Some solar financing agreements include clauses that allow the solar company to retain net metering income under certain conditions. In a lease or PPA, confirm that any net metering credits flow to your electricity account, not to the solar company. In a solar loan, you own the system and receive all net metering credits directly — this is one of the key financial advantages of ownership over leasing.
Frequently Asked Questions
What is the average monthly payment for a solar loan?
For an average US 8kW solar system with a net cost of approximately $16,800 after the 30% federal tax credit, the monthly payment on a 10-year solar loan at 5.99% APR is approximately $186 per month. At 6.99% APR, the payment is approximately $196 per month. On a 15-year term at 4.99% APR, the payment drops to approximately $133 per month. In all cases, monthly electricity savings from the system typically offset $140 to $220 of this payment in average US markets.
Is a solar lease or a solar loan cheaper per month?
A solar lease is typically cheaper per month ($80 to $150 for most system sizes) than a solar loan ($100 to $200 for the same system). However, the loan is the better financial choice in nearly every scenario — because loan customers own the system, claim the 30% tax credit, retain all net metering income, and end the monthly payment after 10 to 15 years while continuing to receive full electricity savings. The lease payment continues for 20 years and increases annually.
Does a solar loan affect my monthly budget from day one?
In most US markets, a solar loan has a near-neutral to positive effect on your monthly budget from day one — because the loan payment is partially or fully offset by electricity savings. In high-rate states like California, Hawaii, and Massachusetts, monthly savings often exceed the loan payment, making solar cash-flow positive immediately. In lower-rate states, the loan payment may exceed savings by $20 to $40 per month initially — but this gap narrows as electricity prices rise, and disappears entirely when the loan is paid off.
What happens to my monthly solar cost after the loan is paid off?
After your solar loan is paid off — typically in year 10 or year 12 — your monthly solar cost drops to zero. But your electricity savings continue for the remaining 13 to 15 years of the panel warranty. This post-payoff period is when solar delivers its most significant financial benefit: full monthly electricity savings with no offsetting payment. For a homeowner saving $160 per month, the 13 years after a 12-year loan payoff generates approximately $24,960 in savings — the single largest portion of the system’s total lifetime return.