
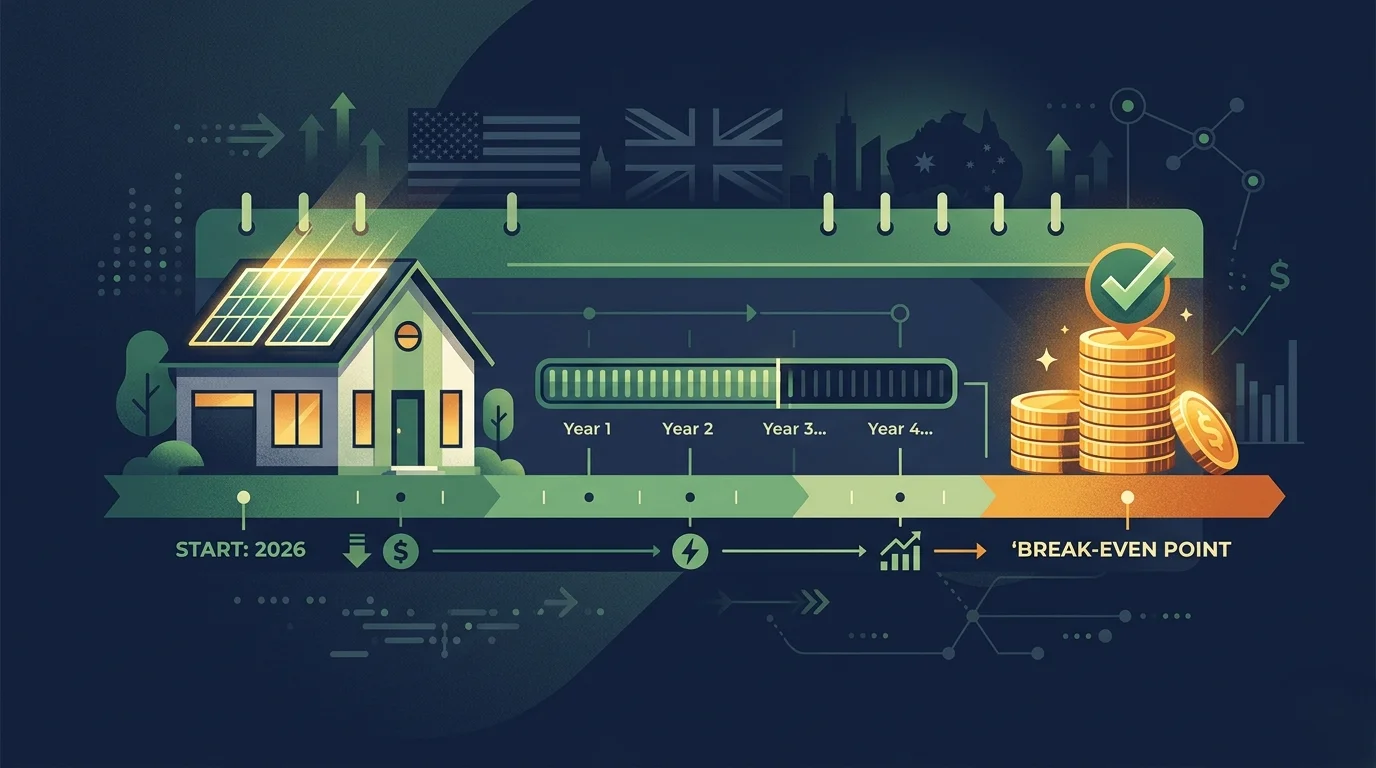
The first question most people ask once they see a solar quote is not ‘how much does it cost?’ — it is ‘when will it pay for itself?’ That is exactly the right instinct. The payback period is the number that tells you when your solar investment stops costing you money and starts making you money. Everything before break-even is repayment. Everything after is pure profit.
When I ran the numbers for a neighbour of mine in Phoenix last year, his payback period came out at 5.8 years on a net investment of $15,200. That meant that from year six onward — for the remaining 19 years of his panel warranty — his system would be generating pure savings. By year 25, his projected net gain was over $76,000. That is a 500% return on his original investment over the warranty period.
But payback periods are not uniform. The same system installed in London would take over 12 years to break even. Installed in parts of Louisiana, it might take 14 years. Installed in Sydney, Australia, it could pay itself back in under five years. Understanding why these numbers differ so dramatically — and where your home falls on that spectrum — is what this guide covers in full.
The Key Number:
| The average solar panel payback period for a US homeowner in 2026 is 7 to 9 years after the 30% federal tax credit. In the best US markets — Arizona, Hawaii, California — payback of 5 to 7 years is realistic. Australia leads globally at 4 to 6 years. The UK and Canada typically range from 10 to 13 years. The single biggest variable in all cases is your local electricity rate. |
📊 NREL: National Renewable Energy Laboratory — Solar Payback and ROI Benchmark Data 2026
📌 Also Read:
| →How Much Do Solar Panels Save? Real Savings Data by State 2026 → Are Solar Panels Worth It in 2026? The Complete Honest Answer |
How Long Does It Take for Solar Panels to Pay for Themselves in 2026?
The solar panel payback period is the number of years it takes for your cumulative electricity savings to equal your net installation cost. Once you cross that line, every additional year of solar generation is pure financial gain — electricity you would otherwise pay for, now produced for free by a system you already own.
In 2026, the average US solar payback period after the 30% federal Investment Tax Credit is 7 to 9 years. But state-by-state and country-by-country, the range is enormous — from under 5 years in Australia and parts of the US Southwest, to 13 or more years in cloudy, lower-rate markets.
| 7–9 years | 5–7 years | 4–6 years | 10–13 years |
| US average payback period | AZ, HI, CA best case | Australia avg. payback | UK / Canada avg. payback |
Which uses your exact location, electricity rate, and system cost to produce a personalised break-even timeline. But read on to understand exactly what drives the number — and what you can do to shorten it.
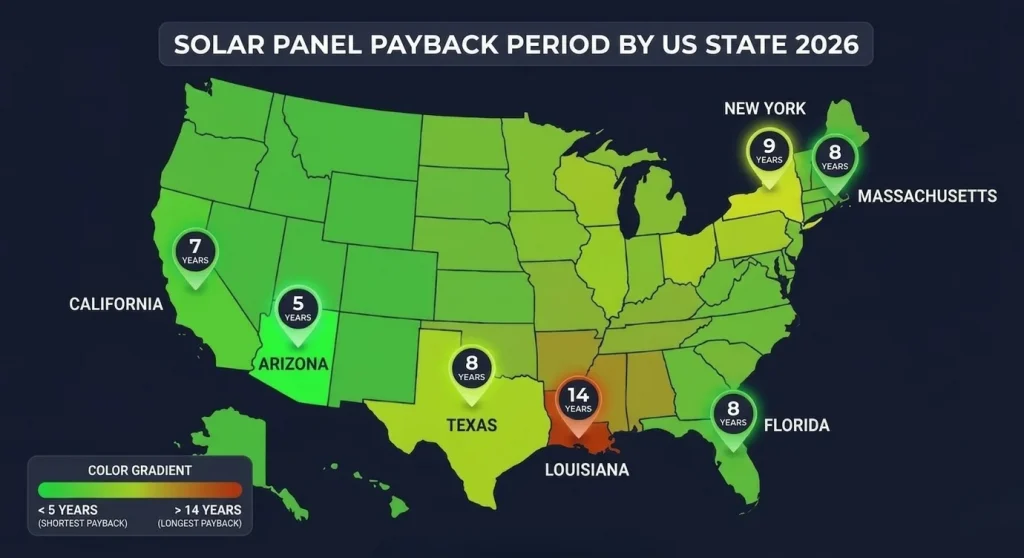
Solar Panel Payback Period by US State — Real 2026 Data
No two states produce the same solar payback period. The combination of your electricity rate (how valuable each solar kWh is) and your local peak sun hours (how much your system generates) determines the timeline. Here is the state-by-state picture for a standard 8kW system in 2026, after the 30% federal ITC:
| State | Net Cost (8kW) | Electricity Rate | Annual Savings | Payback Period | 25-Yr Net Gain |
| Arizona | $15,680 | 13¢/kWh | $2,520/yr | 6.2 yrs | $78,000 |
| Hawaii | $16,800 | 42¢/kWh | $3,780/yr | 4.4 yrs | $102,000 |
| California | $18,480 | 28¢/kWh | $2,730/yr | 6.8 yrs | $70,000 |
| Nevada | $15,120 | 13¢/kWh | $2,340/yr | 6.5 yrs | $66,000 |
| Florida | $16,240 | 13¢/kWh | $2,040/yr | 7.9 yrs | $55,000 |
| Massachusetts | $19,040 | 26¢/kWh | $2,580/yr | 7.4 yrs | $65,000 |
| New Jersey | $17,640 | 17¢/kWh | $2,160/yr | 8.2 yrs | $54,000 |
| Texas | $15,960 | 13¢/kWh | $1,980/yr | 8.1 yrs | $50,000 |
| New York | $19,600 | 24¢/kWh | $2,160/yr | 9.1 yrs | $54,000 |
| Colorado | $16,520 | 14¢/kWh | $1,920/yr | 8.6 yrs | $48,000 |
| Georgia | $15,680 | 12¢/kWh | $1,680/yr | 9.3 yrs | $42,000 |
| Illinois | $16,800 | 13¢/kWh | $1,620/yr | 10.4 yrs | $40,000 |
| Michigan | $17,360 | 17¢/kWh | $1,740/yr | 10.0 yrs | $43,000 |
| Louisiana | $14,000 | 9¢/kWh | $1,080/yr | 13.0 yrs | $27,000 |
Net cost figures assume the 30% federal ITC applied. Annual savings assume the system covers approximately 90% of household electricity usage. Actual figures vary by system size, roof orientation, shading, and local net metering policy.
📊 EnergySage: EnergySage Solar Marketplace — State-by-State Payback Period Data 2026
Solar Panel Payback Period by Country — International 2026 Data
Outside the US, payback periods vary just as dramatically. Australia consistently delivers the world’s fastest solar payback thanks to its combination of high electricity rates, abundant sunshine, and generous STC government rebates that dramatically reduce net installation costs. The UK delivers a longer payback despite high electricity rates, primarily because of low peak sun hours — but still provides a solid long-term return.
| Country | Net Cost (8kW) | Rate/kWh | Annual Savings | Payback Period | 25-Yr Net Gain |
| Australia | AUD $6,200 | 30¢ AUD | AUD $2,640/yr | 4.6 yrs | AUD $82,000 |
| Spain | €8,960 | 29¢ EUR | €1,740/yr | 5.1 yrs | €40,000 |
| UAE | AED 36,000 | 8¢ USD eq | AED 6,480/yr | 5.6 yrs | AED $162,000 |
| United States | $15,680 avg | 16¢ avg | $1,960/yr | 8.0 yrs | $49,000 |
| Germany | €10,240 | 31¢ EUR | €1,380/yr | 7.4 yrs | €35,000 |
| Netherlands | €10,744 | 32¢ EUR | €1,320/yr | 8.1 yrs | €33,000 |
| Canada | CA$16,800 | 13¢ CAD | CA$1,440/yr | 11.7 yrs | CA$36,000 |
| United Kingdom | £14,400 | 34p | £1,140/yr | 12.6 yrs | £18,500 |
| India | ₹288,000 | 7¢ USD eq | ₹33,600/yr | 8.6 yrs | ₹840,000 |
Australia’s figures reflect a net cost after STC rebates of approximately AUD $6,200 for an 8kW system — substantially lower than comparable US or European installations. The UAE benefits from extremely high sun hours (6.0/day) despite a low electricity rate, producing a competitive payback period.
📊 IEA: International Energy Agency — Solar PV Cost and Return Data 2026
What Determines How Long Solar Panels Take to Pay Off?
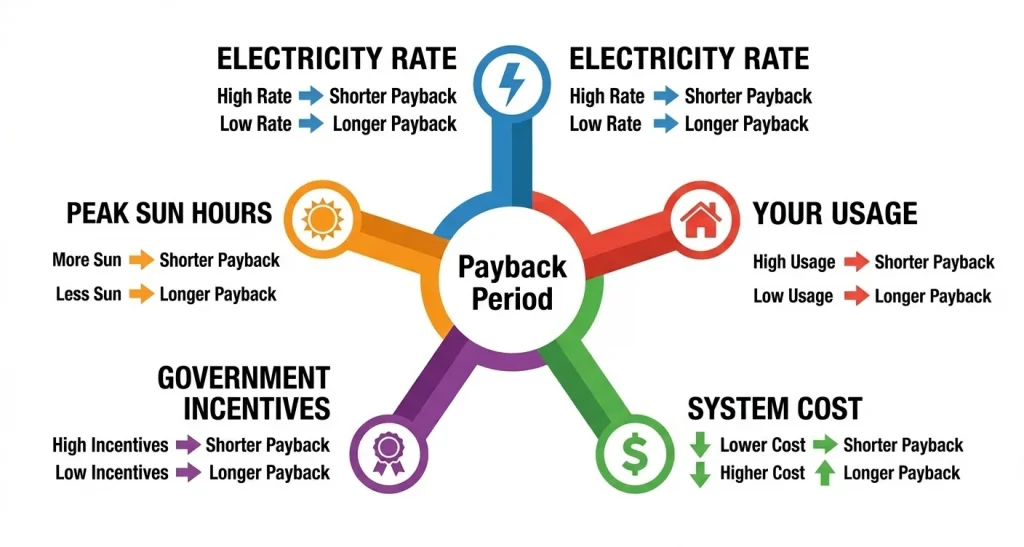
Five variables account for nearly all the variation in solar payback periods worldwide. Understanding them is the key to both calculating your own payback accurately and knowing what levers you can pull to shorten it.
Factor 1 — Your Electricity Rate (Most Important)
The more you pay per kilowatt-hour, the faster each solar kWh offsets your investment. Consider two identical 8kW systems producing 10,000 kWh per year with a net cost of $16,000:
| Electricity Rate | Annual Savings | Payback Period |
| 42¢/kWh (Hawaii) | $4,200/yr | 3.8 years |
| 28¢/kWh (California) | $2,800/yr | 5.7 years |
| 16¢/kWh (US average) | $1,600/yr | 10.0 years |
| 9¢/kWh (Louisiana) | $900/yr | 17.8 years |
Same system. Same sun. Same cost. But the payback period varies from under 4 years to nearly 18 years — purely because of electricity rate. This is why checking your electricity rate before calculating payback is non-negotiable.
Factor 2 — Your Local Peak Sun Hours
Peak sun hours determine how much electricity your panels actually produce. In Arizona (6.5 hours/day), an 8kW system produces approximately 15,000 kWh per year. In the UK (2.8 hours/day), the same system produces roughly 6,500 kWh — less than half. Even with the UK’s high electricity rate compensating somewhat, the dramatically lower generation extends the payback period significantly.
Factor 3 — Your Net System Cost After Incentives
The lower your net installation cost, the faster the payback. This is where government incentives have an enormous impact. The US 30% federal ITC alone reduces a $22,000 system to $15,400 — shortening the payback period by approximately 2.5 years compared to paying full price. Australian STC rebates can reduce an 8kW system from AUD $8,800 to approximately AUD $6,200 — producing some of the shortest payback periods in the world.
Factor 4 — Your Installer’s Price
Installation costs for identical systems can vary by 30 to 50 percent between installers in the same market. A homeowner who gets three quotes and chooses a competitive installer may pay $19,000 for a system that another installer quoted at $27,000. That $8,000 difference represents roughly 4 to 5 additional years of payback at typical savings rates. Always get at least three quotes — the savings on your installation cost can be as significant as the savings on your electricity bill.
Factor 5 — Your Electricity Consumption Pattern
A solar system is most financially efficient when most of its generation is consumed directly — powering your appliances during the day rather than being exported to the grid. If you work from home or run major appliances during daylight hours (dishwasher, washing machine, EV charging), your self-consumption rate is higher, which increases the effective value of each solar kWh and shortens your payback period.
Conversely, if you are out of the home all day and your system exports most of its generation at a lower net metering rate than your retail rate, the effective value of your generation is reduced. Time-shifting major appliance usage to daytime hours is one of the easiest ways to improve your solar economics without any additional cost.
How to Calculate Your Own Solar Payback Period
The solar payback period calculation is straightforward once you have the key inputs. Here is the formula and a worked example:
The Payback Period Formula
Payback Period (years) = Net System Cost ÷ Annual Electricity Savings
Where:
- Net System Cost = Total installation cost minus all applicable incentives (federal ITC, state rebates, etc.)
- Annual Electricity Savings = Annual solar generation (kWh) × your electricity rate ($/kWh) + net metering credits
Worked Example — Phoenix, Arizona
| Input | Value |
| System size | 8 kW |
| Gross installation cost | $22,400 |
| Federal ITC (30%) | −$6,720 |
| Net cost after ITC | $15,680 |
| Peak sun hours (Phoenix) | 6.5 hrs/day |
| Annual generation estimate | 8 kW × 6.5 hrs × 365 × 0.80 = 15,184 kWh |
| Electricity rate | 13¢/kWh |
| Annual savings | 15,184 kWh × $0.13 = $1,974/yr |
| Payback period | $15,680 ÷ $1,974 = 7.9 years |
| 25-year net gain | ($1,974 × 25) − $15,680 = $33,670 |
This example uses a conservative electricity rate — Phoenix rates for heavy summer users can push 18¢/kWh or above, which would reduce the payback period to approximately 5.5 years and increase the 25-year net gain significantly.
📌 Also Read:
6 Proven Ways to Shorten Your Solar Payback Period
You have more control over your payback period than most people realise. Here are the six most impactful ways to shorten it — some before installation, some after.
1. Claim Every Available Incentive
The 30% federal ITC is the biggest single lever in the US — but many homeowners miss additional state-level incentives, utility rebates, and SREC income. In New Jersey, SREC income can add $200 to $400 per year to your solar returns. In Massachusetts, the SMART programme provides additional per-kWh payments on top of net metering. Run a thorough incentive check before signing any installation contract.
2. Get at Least 3 Competitive Installer Quotes
As noted above, installation costs vary enormously. A 30% reduction in installation cost translates directly to a 30% shorter payback period, all else being equal. Use platforms like EnergySage (US) or Solar Choice (Australia) to compare multiple certified quotes. The 2 to 3 hours spent comparing quotes can save you 3 to 4 years of payback time.
3. Right-Size Your System
A correctly sized system — one that covers approximately 80 to 100% of your annual usage — produces the best payback. Over-sizing leads to excess generation that may be compensated at lower export rates, reducing the effective value of your investment. Under-sizing means you are still buying expensive grid electricity that solar could have covered. Our solar savings calculator automatically recommends the optimal system size for your usage.
4. Shift Your Heavy Appliance Use to Daytime
Running your washing machine, dishwasher, and EV charger during peak solar generation hours (typically 9am to 3pm) maximises self-consumption — the portion of your solar generation you use directly rather than exporting. Each extra kWh you consume directly rather than export is worth your full retail rate rather than the (often lower) export rate. For a household with smart scheduling, this can add $100 to $300 per year to effective savings with zero additional cost.
5. Add a Battery to Maximise Self-Consumption
A home battery system stores your excess midday generation and dispatches it in the evening when your solar panels are no longer producing. This increases your self-consumption rate from a typical 40 to 50% without storage to 70 to 90% with storage — dramatically improving the effective value of your generation. The trade-off is that batteries add $8,000 to $15,000 to your installation cost, which typically adds 3 to 6 years to the initial payback period before delivering long-term benefit.
6. Choose an Orientation That Maximises Production
If your roof has multiple orientations available, choose the installation location that maximises annual generation — which is typically the south-facing slope with the least shading. The difference between a south-facing and west-facing roof installation can be 15 to 25% in annual production, directly affecting your savings and payback timeline. A qualified installer will model your roof orientations before recommending panel placement.
What Happens After Your Solar Panels Pay for Themselves?
This is the question that most payback period discussions skip — but it is arguably the most important part of the solar financial story. Once you reach break-even, your solar system transitions from an investment you are repaying to an asset generating pure returns.
For a homeowner who breaks even in year 8 on a 25-year warrantied system, there are 17 years of pure profit ahead. At $1,800 per year in savings (compounding upward with electricity price increases), that represents $30,600 in base savings — plus the compounding effect of rising grid rates making each subsequent year more valuable.
Solar panels typically degrade at approximately 0.5% output per year — meaning an 8kW system in year 25 is still producing around 87% of its original rated output. After year 25, panels continue to generate electricity at reduced output — most installers report real-world systems producing usable power at 30 years and beyond, though without the manufacturer’s performance warranty.
The financial picture does not end at break-even. It is the beginning of the most profitable phase of the investment.
📊 DOE: U.S. Department of Energy — Long-Term Solar Panel Performance and Durability Research
Solar Payback Period: Realistic Expectations by Market Type
To summarise the data practically, here is a clear framework for what to expect based on your market conditions:
| Market Type | Examples | Typical Payback | Worth It? |
| Exceptional | Hawaii, Arizona, California, Australia, Spain | 4–7 years | ✅ Strongly yes |
| Very Strong | Florida, Nevada, Massachusetts, New Jersey, UAE | 6–9 years | ✅ Yes |
| Good | Texas, Colorado, New York, Germany, Netherlands | 8–11 years | ✅ Yes, especially long-term |
| Moderate | Illinois, Michigan, Canada, India | 10–13 years | ⚠️ Yes if staying 15+ yrs |
| Challenging | Louisiana, Arkansas, UK, low-sun regions | 12–16 years | ⚠️ Marginal — depends on incentives |
Even in ‘challenging’ markets, a 13-year payback on a 25-year system still delivers 12 years of profit. The question is whether you will own the property long enough — and whether the energy cost savings during the payback period justify the capital commitment.
Frequently Asked Questions
How long does it take for solar panels to pay for themselves on average?
The average solar panel payback period for a US homeowner in 2026 is 7 to 9 years, after the 30% federal tax credit. In sun-rich, high-rate states like Arizona, California, and Hawaii, payback of 5 to 7 years is common. Australia leads globally with average payback periods of 4 to 6 years. The UK and Canada typically see 10 to 13 years due to lower sun hours or electricity rates.
Does the 30% solar tax credit reduce my payback period?
Yes — significantly. The federal ITC effectively reduces your net installation cost by 30%, which directly shortens your payback period by roughly 2.5 to 3.5 years depending on your annual savings. On a $22,000 system, the $6,600 credit brings your net cost to $15,400 — and that $6,600 difference represents years of accelerated payback. Always calculate your payback period using the net cost after all applicable incentives, not the gross installation price.
Do solar panels still pay off if my electricity rate is low?
A low electricity rate extends the payback period considerably and can make solar a marginal investment. Below 9 to 10¢/kWh (Louisiana, some rural areas), payback periods can stretch to 14 to 18 years, which is difficult to justify financially unless you plan a very long tenure in the property. Above 14¢/kWh, solar is generally worthwhile in good-sun markets. Above 20¢/kWh, solar almost always delivers strong returns regardless of sun hours.
What happens if I sell my house before my solar panels pay off?
If you sell before reaching break-even, you do not lose your solar investment. Studies from Lawrence Berkeley National Laboratory show solar panels increase home resale value by an average of 3 to 4% in the US — which can recoup most or all of your remaining uncovered investment. The exact premium depends on your local property market, buyer demographics, and the system’s remaining warranty period. In strong solar markets like California and Arizona, the resale premium can fully offset any shortfall from an early sale.