
The question I get most often from friends and family when they find out I write about solar is not ‘how much does it cost?’ — it is ‘how much will I actually see come off my bill each month?’ That is the right question to ask. Monthly savings is the number that makes solar feel real and tangible. It is what you see when your electricity bill arrives in the first month after installation.
My friend Karen installed a 7kW system in Sacramento last spring. Her pre-solar bill averaged $210 a month. Her first post-solar bill was $22 — a basic connection charge she cannot avoid regardless of how much she generates. Her monthly saving in that first month was $188. By the time she hit summer and her panels were running at peak output, her July bill was a $14 credit from net metering.
But Karen is in California, with one of the highest electricity rates in the country and excellent sun hours. The same system in Louisiana would save a fraction of that. Understanding what the average solar panel saving per month actually is — and what drives the variation — is what this guide covers in full.
The National Average:
| The average US homeowner with solar panels saves $125 to $167 per month on their electricity bill in 2026 — equivalent to $1,500 to $2,000 per year. But the real range runs from under $80 per month in low-rate states to over $300 per month in Hawaii and California. Your electricity rate is the single biggest factor in your monthly saving. |
📊 EIA: U.S. Energy Information Administration — Residential Electricity Rates and Solar Savings 2026
📌 Also Read:
| → How Much Do Solar Panels Save? Full Annual Data by State → Are Solar Panels Worth It in 2026? The Complete Honest Answer |
What Is the Average Solar Panel Saving Per Month in 2026?
The average monthly saving from solar panels for a US homeowner in 2026 is $125 to $167 per month — based on a standard 8kW system covering approximately 90% of a home consuming 900 kWh/month at the US average electricity rate of 16¢/kWh.
But that average is less useful than it sounds, because the actual range is enormous. Here is the full spectrum:
| $125–$167/mo | $280–$340/mo | $80–$110/mo | $190–$240/mo |
| US national average saving | Hawaii / high-rate states | Low-rate states (LA, WY) | Australia average saving |
The variation exists because monthly savings are directly proportional to your electricity rate — the more you currently pay per kWh, the more valuable each kWh your solar panels generate. A homeowner in Hawaii paying 42¢/kWh saves more than four times as much per kWh of solar generation as a homeowner in Louisiana paying 9¢/kWh, even with an identical system.
Average Monthly Solar Savings by US State — 2026 Data
Here is the state-by-state breakdown of average monthly electricity bill savings for a correctly sized solar system in 2026. Figures assume a system sized to cover 90% of average household consumption for each state, at the prevailing electricity rate and peak sun hours:
| State | Rate/kWh | Peak Sun Hrs | Monthly Saving | Annual Saving | Seasonal Variation |
| Hawaii | 42¢ | 5.7 hrs | $280–$340/mo | $3,360–$4,080 | Low — year-round sun |
| California | 28¢ | 5.8 hrs | $185–$230/mo | $2,220–$2,760 | Moderate — mild winters |
| Massachusetts | 26¢ | 4.3 hrs | $170–$210/mo | $2,040–$2,520 | High — cold dark winters |
| New York | 24¢ | 4.5 hrs | $155–$195/mo | $1,860–$2,340 | High — cold winters |
| New Jersey | 17¢ | 4.6 hrs | $135–$170/mo | $1,620–$2,040 | Moderate-High |
| Arizona | 13¢ | 6.5 hrs | $155–$200/mo | $1,860–$2,400 | Low — hot sunny summers |
| Florida | 13¢ | 5.3 hrs | $145–$185/mo | $1,740–$2,220 | Low-Moderate |
| Texas | 13¢ | 5.5 hrs | $130–$170/mo | $1,560–$2,040 | Moderate — hot summers |
| Colorado | 14¢ | 5.0 hrs | $130–$165/mo | $1,560–$1,980 | High — cold winters |
| Illinois | 13¢ | 4.3 hrs | $105–$140/mo | $1,260–$1,680 | Very High — harsh winters |
| Georgia | 12¢ | 5.0 hrs | $115–$150/mo | $1,380–$1,800 | Moderate |
| Michigan | 17¢ | 4.0 hrs | $125–$160/mo | $1,500–$1,920 | High — long winters |
| Louisiana | 9¢ | 5.0 hrs | $80–$110/mo | $960–$1,320 | Low-Moderate |
The ‘Seasonal Variation’ column is important — it tells you how much your monthly saving fluctuates through the year. In Hawaii and Arizona, sunshine is relatively consistent year-round, so monthly savings stay stable. In Massachusetts, New York, and Illinois, short winter days and cloud cover mean winter months generate significantly less than summer months — you might save $80 in January and $280 in July.
📊 NREL: National Renewable Energy Laboratory — Monthly Solar Generation and Savings Profiles 2026
Why Monthly Solar Savings Vary So Much — The 3 Core Drivers
Three variables explain almost all of the variation in monthly solar savings between homeowners, states, and countries. Understanding them lets you estimate your own monthly saving with confidence.
Driver 1 — Your Electricity Rate
Your electricity rate is the most powerful lever in the monthly savings calculation. The relationship is direct and linear: double your electricity rate, double your monthly savings from the same system.
| Rate /kWh | Annual Solar Generation (8kW, 4.5 sun hrs) | Monthly Saving | Annual Saving |
| 9¢ (Louisiana) | 10,512 kWh | $79/mo | $946/yr |
| 13¢ (Texas) | 10,512 kWh | $114/mo | $1,367/yr |
| 16¢ (US average) | 10,512 kWh | $140/mo | $1,682/yr |
| 24¢ (New York) | 10,512 kWh | $210/mo | $2,523/yr |
| 28¢ (California) | 10,512 kWh | $245/mo | $2,943/yr |
| 42¢ (Hawaii) | 10,512 kWh | $368/mo | $4,415/yr |
Same system. Same sun. Same output. The Hawaii homeowner saves $368 per month — nearly five times the $79 monthly saving of the Louisiana homeowner — because their electricity costs almost five times as much per unit. If your electricity rate is above 20¢/kWh, solar almost certainly delivers excellent monthly savings.
Driver 2 — Your Local Peak Sun Hours
Peak sun hours determine how much electricity your panels produce each month. More production means a larger offset against your bill — and higher monthly savings. Consider a homeowner in each of these locations with the same 8kW system at the same electricity rate of 16¢/kWh:
| Location | Peak Sun Hrs/Day | Monthly Generation | Monthly Saving @ 16¢ |
| Arizona | 6.5 hrs | 1,266 kWh | $202/mo |
| California | 5.8 hrs | 1,129 kWh | $181/mo |
| Texas | 5.5 hrs | 1,070 kWh | $171/mo |
| New York | 4.5 hrs | 876 kWh | $140/mo |
| Pacific Northwest | 3.5 hrs | 681 kWh | $109/mo |
| UK (London average) | 2.8 hrs | 545 kWh | £87/mo at 32p |
Arizona’s homeowner saves nearly double what the Pacific Northwest homeowner saves, even at the same electricity rate — purely because of sun hours. This is why solar economics are strongest in the Sun Belt states and why UK homeowners rely more heavily on their high electricity rate to drive the financial case.
Driver 3 — Your Monthly Electricity Consumption
A correctly sized solar system is designed to cover a specific percentage of your monthly consumption. If your consumption is high, a proportionally larger system is needed — but it also generates proportionally more savings. The relationship between consumption and savings is direct: homeowners who use more electricity save more per month with solar, provided their system is sized to match.
- 500 kWh/month household (small home or apartment): saves $60–$100/month at avg US rates
- 900 kWh/month household (average US home): saves $125–$167/month at avg US rates
- 1,400 kWh/month household (large home or EV): saves $200–$270/month at avg US rates
- 2,000 kWh/month household (large home + pool + EV): saves $280–$380/month at avg US rates
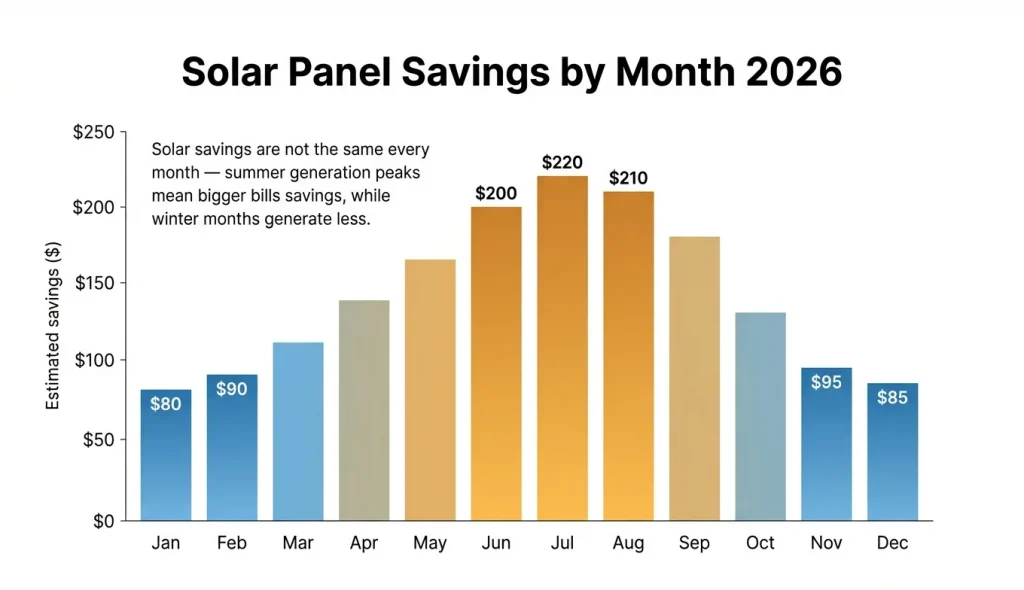
How Monthly Solar Savings Change Through the Year
One aspect of solar savings that surprises many new owners is that their monthly bill reduction is not the same every month. Solar panels produce significantly more in summer than winter — and your monthly saving reflects that variation.
| Month | New York (24¢/kWh) | Texas (13¢/kWh) | California (28¢/kWh) | Arizona (13¢/kWh) |
| January | $85–$110 | $95–$120 | $160–$195 | $160–$195 |
| February | $100–$130 | $105–$135 | $175–$215 | $175–$210 |
| March | $140–$175 | $130–$165 | $210–$255 | $210–$255 |
| April | $170–$215 | $155–$195 | $250–$305 | $245–$295 |
| May | $195–$245 | $170–$215 | $275–$335 | $270–$325 |
| June | $210–$265 | $180–$225 | $290–$355 | $285–$345 |
| July | $215–$270 | $185–$235 | $295–$365 | $295–$355 |
| August | $210–$265 | $180–$230 | $285–$350 | $290–$350 |
| September | $185–$235 | $165–$210 | $265–$325 | $270–$325 |
| October | $155–$195 | $145–$185 | $230–$280 | $245–$295 |
| November | $110–$140 | $115–$145 | $185–$225 | $195–$235 |
| December | $80–$100 | $90–$115 | $155–$190 | $155–$190 |
The seasonal swing is most pronounced in northern states — a New York homeowner might save $85 in January and $270 in July. Arizona and California show less variation because of more consistent sun hours through the year. These are approximate ranges based on typical generation profiles — your exact figures will depend on system size, orientation, and local weather patterns.
📊 EnergySage: EnergySage — Average Monthly Solar Savings and Seasonal Variation Guide
📌 Also Read:
Average Monthly Solar Savings by Electricity Bill Size
Your current electricity bill is the single fastest proxy for your solar savings potential — because it reflects both your consumption and your rate in a single number. Here is the monthly savings estimate for homeowners at different bill sizes in a mid-range US market (16¢/kWh, 4.5 sun hours):
| Current Monthly Bill | System Size | Monthly Saving | Annual Saving | Payback Period | Worth It? |
| $50–$80/month | 3–4 kW | $40–$65/mo | $480–$780/yr | 15–18 yrs | ⚠️ Marginal |
| $80–$120/month | 4–6 kW | $65–$100/mo | $780–$1,200/yr | 11–14 yrs | ⚠️ Possible |
| $120–$180/month | 6–9 kW | $100–$155/mo | $1,200–$1,860/yr | 8–11 yrs | ✅ Good |
| $180–$250/month | 9–12 kW | $155–$215/mo | $1,860–$2,580/yr | 7–9 yrs | ✅ Strong |
| $250–$350/month | 12–17 kW | $215–$300/mo | $2,580–$3,600/yr | 5–8 yrs | ✅ Excellent |
| $350+/month | 17 kW+ | $300+/mo | $3,600+/yr | 4–7 yrs | ✅ Outstanding |
The pattern is clear: for every additional $50 in your monthly electricity bill, solar saves you an additional $40 to $45 per month. If your bill regularly exceeds $150, solar savings are almost certainly substantial enough to justify the investment. Below $80, the maths becomes more marginal in most US markets.
Average Monthly Solar Savings by Country — International 2026
Monthly savings outside the US vary widely — driven by local electricity rates, government feed-in tariffs or net metering equivalents, and available sunshine. Australia consistently leads globally for monthly bill savings, combining high electricity rates with good sun hours and low installation costs.
| Country | Rate/kWh | Peak Sun Hrs | Monthly Saving | Annual Saving | Notes |
| Australia (avg) | 30¢ AUD | 5.3 hrs | AUD $190–$240/mo | AUD $2,280–$2,880 | Exceptional ROI |
| United Kingdom | 34p | 2.8 hrs | £80–£110/mo | £960–£1,320 | +SEG export income |
| Germany | 31¢ EUR | 3.5 hrs | €100–€130/mo | €1,200–€1,560 | Strong rates |
| Spain | 29¢ EUR | 5.2 hrs | €130–€165/mo | €1,560–€1,980 | Sun + high rates |
| Netherlands | 32¢ EUR | 2.7 hrs | €95–€125/mo | €1,140–€1,500 | High rates, low sun |
| Canada (avg) | 13¢ CAD | 4.0 hrs | CA$95–$125/mo | CA$1,140–$1,500 | Variable by province |
| UAE | 8¢ USD | 6.0 hrs | AED 450–560/mo | AED 5,400–$6,720 | Sun offsets low rate |
| India | 7¢ USD | 5.5 hrs | ₹2,200–$3,000/mo | ₹26,400–$36,000 | High volume, low rate |
The UK’s relatively modest monthly saving in GBP (£80 to £110) is partly offset by Smart Export Guarantee income for electricity exported to the grid — adding roughly £100 to £300 per year in additional income on top of bill savings. The UAE’s low electricity rate is compensated by extraordinary sun hours of 6.0 per day.
📊 DOE: U.S. Department of Energy — How Solar Panels Save Money Each Month
How to Increase Your Monthly Solar Savings — 5 Practical Ways
Once your system is installed, there are meaningful steps you can take to maximise the monthly saving you actually see on your bill. These are not theoretical — each one is a documented way to increase the effective value of your solar generation.
1. Shift Heavy Appliance Use to Solar Generation Hours
The most effective and zero-cost way to increase monthly savings is to run your highest-consumption appliances during peak generation hours — typically 9am to 3pm. Dishwasher, washing machine, tumble dryer, and EV charging all benefit from being scheduled during these hours. Each kWh you consume directly from your panels rather than from the grid at night is worth your full retail rate — which is typically higher than the net metering export rate.
Research from the Solar Energy Industries Association shows that homeowners who actively time-shift appliance loads increase their effective self-consumption rate from approximately 40% to 65–80%, meaningfully increasing monthly bill savings with no additional equipment cost.
2. Add a Home Battery for Night-Time Self-Consumption
A home battery stores midday surplus generation and dispatches it in the evening, effectively eliminating the drop-off in self-consumption that occurs after sunset. This increases self-consumption from a typical 40–50% without storage to 70–90% with storage — directly increasing your monthly bill saving. The trade-off is a higher upfront cost ($8,000 to $15,000 for a typical home battery), but in markets with high electricity rates or poor net metering the payback period can be competitive.
3. Monitor Your System and Address Performance Issues Quickly
A solar system that is underperforming — due to a faulty panel, soiling, or inverter issues — silently reduces your monthly saving without an obvious alert. Modern inverters include monitoring apps that show daily and monthly generation. Set a baseline expectation for what your system should produce each month (your installer should provide this) and investigate any month where generation falls more than 15% below expectation.
4. Keep Your Panels Clean
Dust, pollen, bird droppings, and general soiling can reduce panel output by 5 to 15% in dry, dusty climates — translating directly into reduced monthly savings. In most UK and Pacific Northwest climates, rainfall keeps panels adequately clean. In Arizona, Nevada, California Central Valley, and Australia, an annual panel clean (or semi-annual in very dusty areas) restores full output and recovers the lost monthly savings. Professional panel cleaning typically costs $100 to $200 for a standard residential system.
5. Review Your Electricity Plan — Time-of-Use Tariffs
In markets where time-of-use electricity pricing is available, switching to a TOU tariff can significantly increase the value of your solar generation and net metering credits. If your utility charges peak rates of 25¢/kWh in the evening but off-peak rates of 12¢/kWh during the day, your midday solar generation offsets peak-priced evening consumption (via net metering credits) rather than the lower daytime rate. In California, Texas, and parts of Australia, TOU tariff optimisation can add $20 to $60 per month to effective savings.
Monthly Solar Savings vs. Annual Electricity Price Increases
One of the most powerful but underappreciated aspects of solar savings is that they grow over time. Grid electricity prices in the US have risen at an average of 3 to 5% per year over the past decade — and while past trends do not guarantee future performance, structural factors (grid infrastructure investment, fuel costs, carbon pricing) suggest electricity will continue to become more expensive.
Your solar panels generate the same number of kWh in year 10 as they did in year 1 (minus the 0.5% annual degradation). But the value of each kWh they produce increases every time grid electricity prices rise. Here is how that compounds for a homeowner saving $147 per month in year 1, with 4% annual electricity price increases:
| Year | Monthly Saving | Annual Saving | Cumulative Saving |
| Year 1 | $147/mo | $1,764/yr | $1,764 |
| Year 3 | $159/mo | $1,908/yr | $5,436 |
| Year 5 | $173/mo | $2,076/yr | $9,300 |
| Year 8 | $194/mo | $2,328/yr | $16,200 (break-even) |
| Year 10 | $213/mo | $2,556/yr | $21,700 |
| Year 15 | $258/mo | $3,096/yr | $38,400 |
| Year 20 | $314/mo | $3,768/yr | $58,200 |
| Year 25 | $382/mo | $4,584/yr | $82,600 |
By year 25, the same homeowner who started saving $147 per month is saving $382 per month — because the kWh their panels produce are now worth 2.6 times more than when the system was installed. The total 25-year cumulative saving of $82,600 vastly exceeds the original $15,680 net system cost.
Frequently Asked Questions
How much do solar panels save per month on average?
The average US homeowner with solar panels saves $125 to $167 per month in 2026. However, state-by-state the range is $70 to $340 per month. Homeowners in high-rate states like Hawaii ($280 to $340/mo), California ($185 to $230/mo), and Massachusetts ($170 to $210/mo) save the most. Those in lower-rate states like Louisiana ($80 to $110/mo) save the least. The most accurate estimate uses your actual electricity rate and location.
Do solar panels save money every single month?
Yes — solar panels generate electricity and reduce your bill every month, including winter. However, monthly savings are significantly lower in winter due to shorter days and lower sun angle, and significantly higher in summer. In northern states, you might save $85 in January and $265 in July from the same system. In year-round sunny climates like Arizona and Hawaii, the monthly variation is much smaller.
How much do solar panels reduce your electricity bill percentage-wise?
A correctly sized solar system — designed to cover 90 to 100% of your annual electricity consumption — typically reduces your electricity bill by 70 to 90% of the base energy charge. You almost always retain a small monthly connection or service charge ($10 to $30) that cannot be eliminated through generation alone. Some homeowners in strong net metering markets receive credit bills where their net metering earnings offset multiple months of connection fees.
Are solar savings higher in summer or winter?
Summer solar savings are consistently higher than winter savings in all markets outside of tropical regions. In the US, the difference is most pronounced in northern states: Illinois, Michigan, New York, and New England homeowners might save 2.5 to 3 times as much per month in peak summer (June to August) as they do in mid-winter (December to February). In Arizona, Hawaii, and Southern California, the seasonal swing is much smaller due to consistent sun throughout the year.