
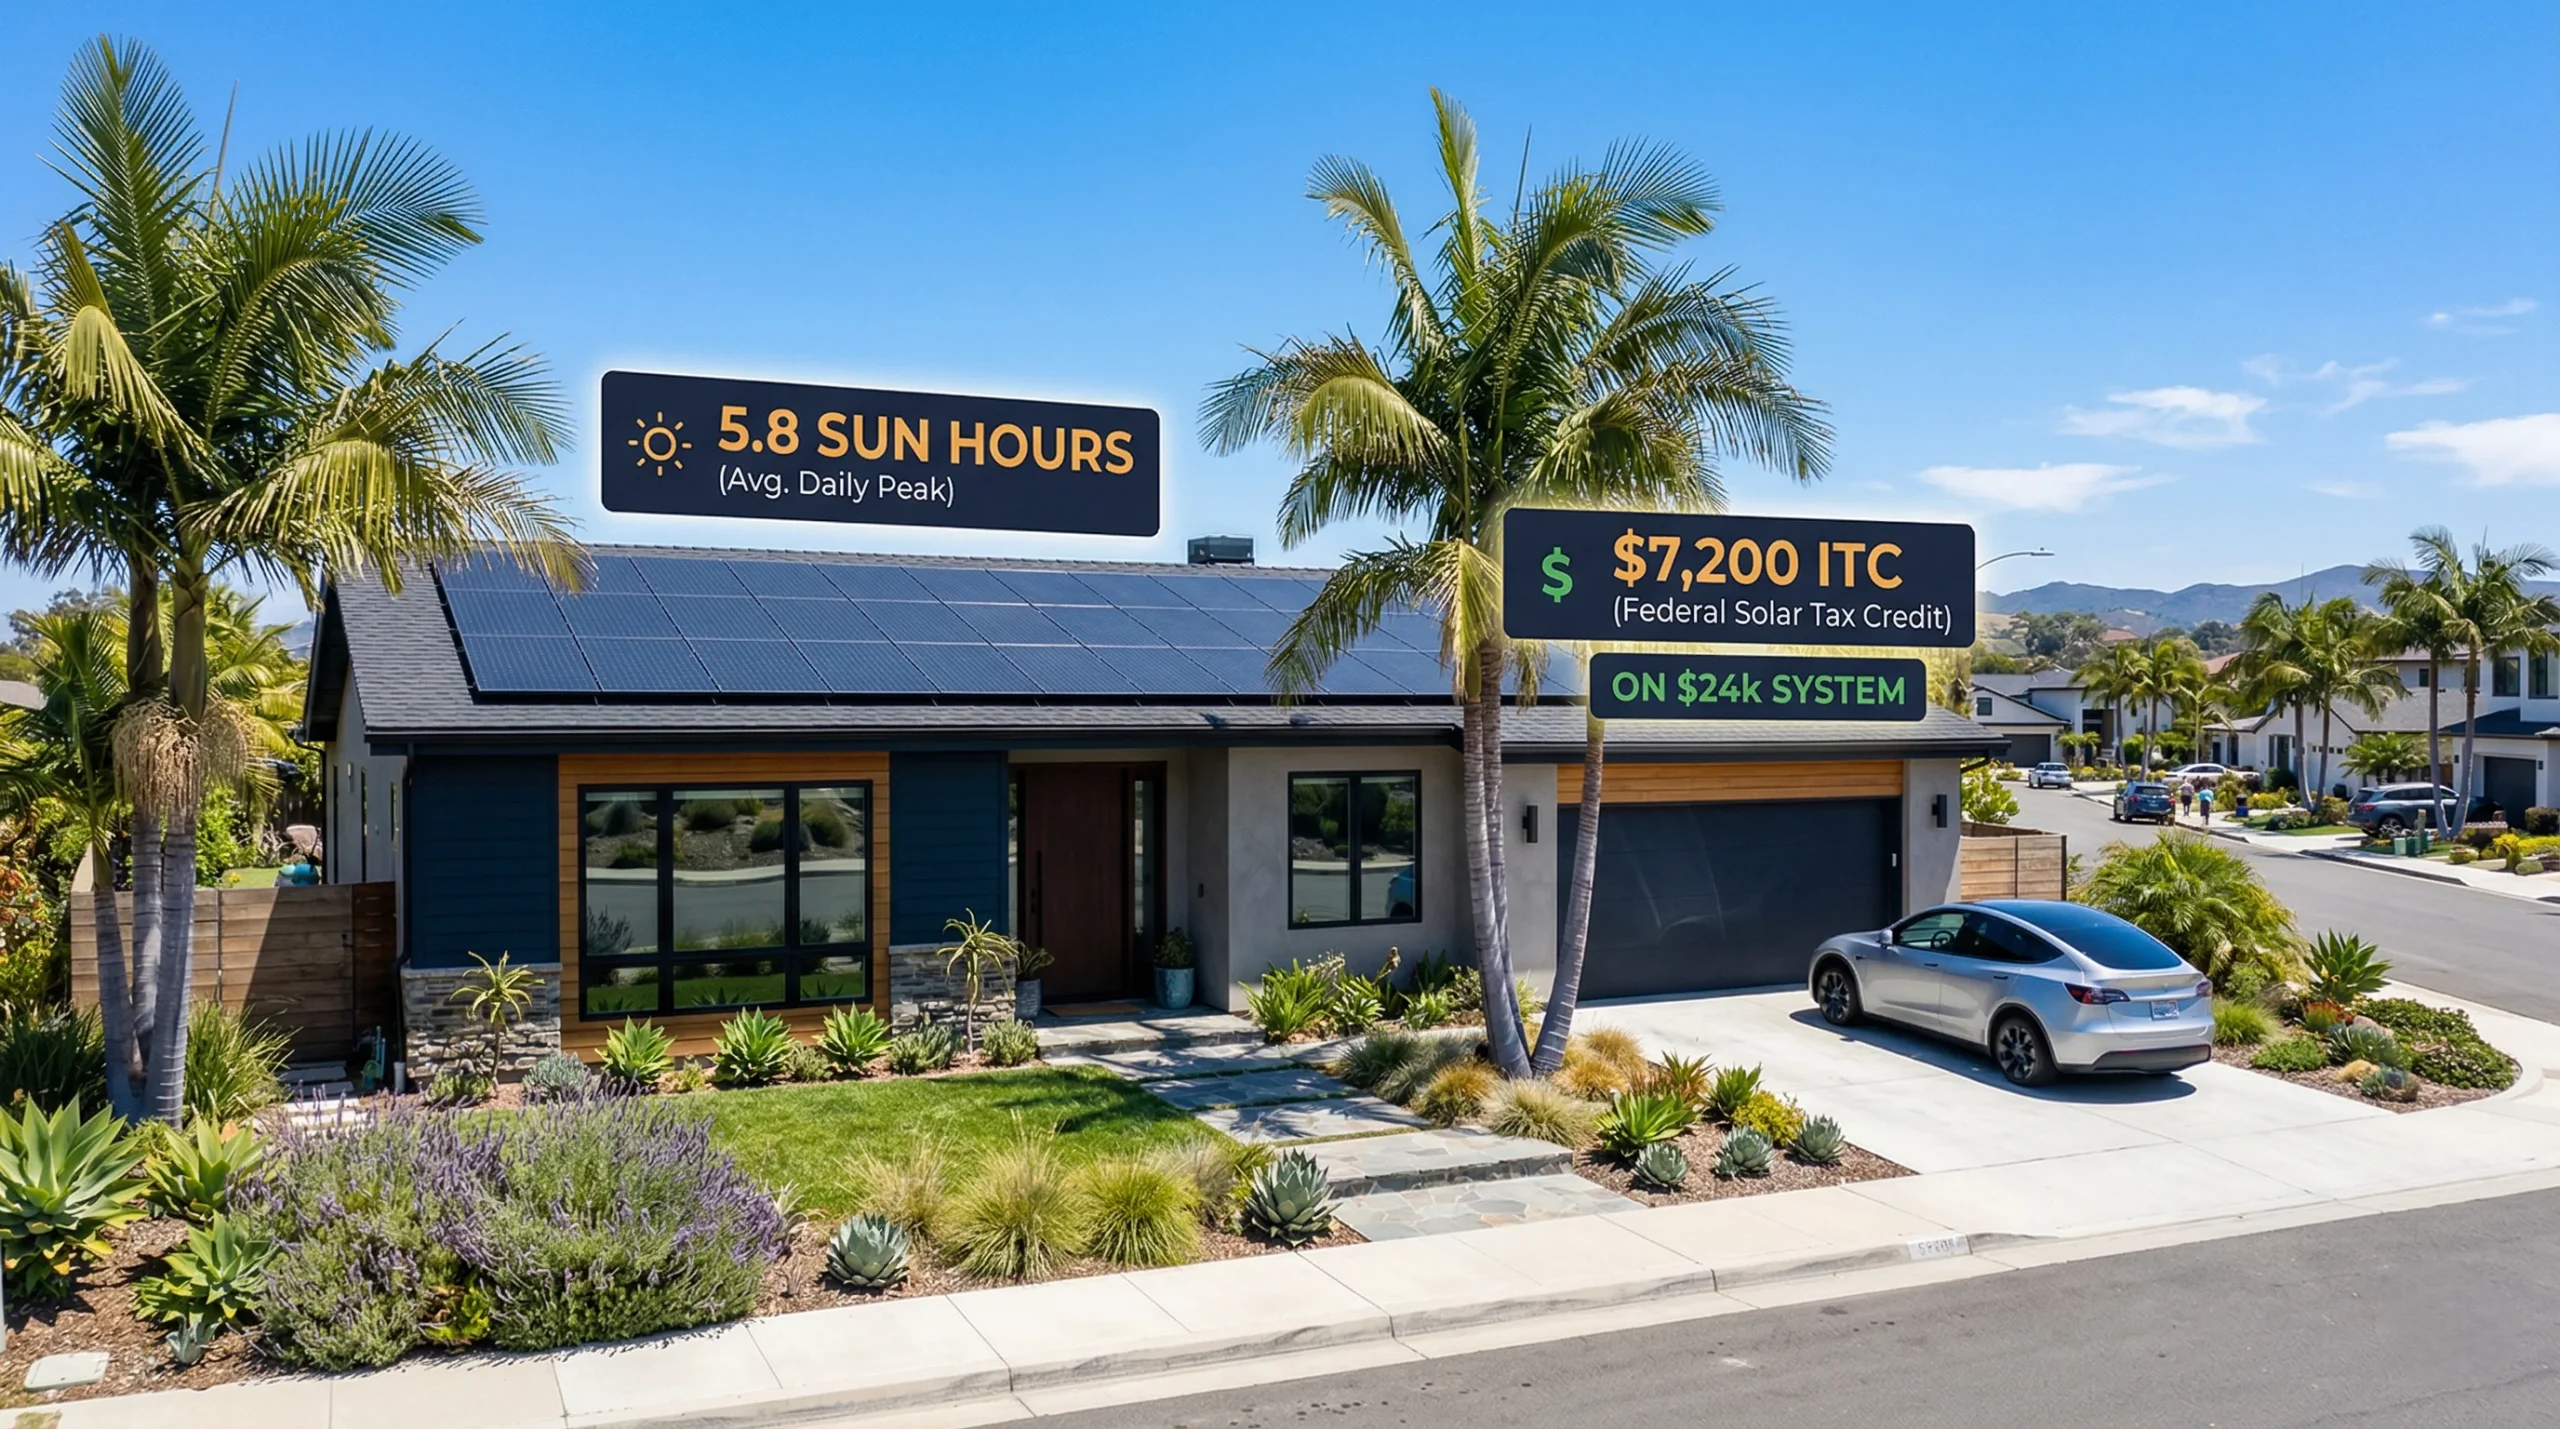
California’s solar market is unlike any other in the United States. It combines the highest electricity rates in the continental US — SDG&E customers pay up to 42¢/kWh — with 5.0 to 6.0 peak sun hours per day, a mature and competitive installer market, and the federal 30% Investment Tax Credit. But April 15, 2023 marked a turning point when NEM 3.0 took effect, replacing full retail-rate net metering with an ‘Avoided Cost Calculator’ export rate of approximately 5 to 9¢/kWh. This single policy change reshaped the economics of California solar.
The good news: self-consumed solar — electricity your home uses directly from the panels — retained its full retail value. Every kWh you generate and use during the day is still worth 28 to 42¢ depending on your utility. The economic shift affects only the surplus generation you export. For homeowners who optimise their usage patterns, add battery storage, or have daytime consumption (home offices, EVs, pools), solar remains an outstanding investment in California in 2026.
This guide gives California homeowners the complete picture: real costs by system size, savings by utility territory, NEM 3.0 explained plainly, every available incentive, and the honest payback data for 2026.
California Solar 2026 — The Bottom Line:
| An 8kW solar system costs $15,680 to $19,040 net after the 30% ITC in California. Annual savings range from $1,800 to $2,600 depending on which utility you are with. Payback periods run 7 to 10 years. Self-consumption optimisation and battery storage are the primary strategies to maximise returns under NEM 3.0. Solar still delivers strong long-term ROI for most California homeowners. |
📌 Also Read:
| → Are Solar Panels Worth It in 2026? National Guide → Net Metering Calculator — How NEM 3.0 Export Credits Work → Solar Tax Credit 2026 — Claim Your Full 30% ITC |
How Much Do Solar Panels Cost in California in 2026?
California has one of the most competitive solar installer markets in the US, with strong pricing in the San Francisco Bay Area, Greater Los Angeles, and San Diego. In 2026, residential solar installation costs $2.80 to $3.40 per watt. A standard 8kW system costs $22,400 to $27,200 gross, dropping to $15,680 to $19,040 after the federal 30% ITC.
| System | Gross Cost | After 30% ITC | Monthly Saving | Annual Saving | Payback |
| 5 kW | $14,000–$17,000 | $9,800–$11,900 | $140–$185/mo | $1,680–$2,220 | 8–10 yrs |
| 6 kW | $16,800–$20,400 | $11,760–$14,280 | $165–$215/mo | $1,980–$2,580 | 7–9 yrs |
| 8 kW | $22,400–$27,200 | $15,680–$19,040 | $200–$255/mo | $2,400–$3,060 | 7–9 yrs |
| 10 kW | $28,000–$34,000 | $19,600–$23,800 | $245–$310/mo | $2,940–$3,720 | 8–10 yrs |
| 8kW + 13.5kWh battery | $34,000–$41,000 | $23,800–$28,700 | $200–$255/mo* | $2,400–$3,060* | 9–12 yrs |
*Battery improves NEM 3.0 economics by converting exports worth 5–9¢ into self-consumption worth 28–42¢. The savings column for battery systems increases by $300–$600/yr in SDG&E and PG&E territory. Always get three quotes — installation price variance of 25–30% for identical systems is common.
📊 EnergySage: California solar cost data 2026
California Utility Rates — Why Your Bill Determines Your ROI
California has three major investor-owned utilities, each with different electricity rates. Where you live directly determines your solar economics — SDG&E customers in San Diego pay the highest rates in the continental US, making solar especially powerful there.
| Utility | Avg. Rate | Service Area | Monthly Saving (8kW) | Payback |
| SDG&E (San Diego) | 34–42¢/kWh | San Diego County | $270–$340/mo | 6–8 yrs |
| PG&E (Bay Area/Central) | 28–35¢/kWh | Northern/Central CA | $220–$285/mo | 7–9 yrs |
| SCE (LA/Inland Empire) | 25–32¢/kWh | Southern CA excl. SD | $200–$255/mo | 7–10 yrs |
| LADWP (City of LA) | 22–28¢/kWh | City of Los Angeles | $175–$225/mo | 8–11 yrs |
| SMUD (Sacramento) | 14–18¢/kWh | Sacramento area | $110–$145/mo | 10–13 yrs |
NEM 3.0 — What Changed and How to Work With It
Before April 2023, California had one of the world’s best net metering programmes — you exported surplus electricity and received credit at the full retail rate. NEM 3.0 replaced this with an ‘Avoided Cost Calculator’ rate that compensates exports at approximately 5 to 9¢/kWh depending on utility and time of day — roughly 80% less than the old retail-rate compensation.
The impact on a typical 8kW system that exports 30% of generation (approximately 2,600 kWh/year): under NEM 2.0, export credits were worth $728 per year at 28¢. Under NEM 3.0, they are worth approximately $156 to $234 per year — a reduction of $494 to $572 annually. This is real and meaningful.
What NEM 3.0 did NOT change: the value of electricity you self-consume. Every kWh your panels generate during daylight that your home uses directly is still worth 28 to 42¢ in import avoidance. NEM 3.0 only changed the export rate. The strategic response is:
- Shift major appliance use to peak solar hours (9am–3pm) — dishwasher, washing machine, EV charging
- Add battery storage to capture midday surplus and use it in the evening — converting 7¢ export into 28¢ import avoided
- Size your system closer to 80–90% of consumption rather than 100–110% — reducing excess generation that would be exported at the low NEM 3.0 rate
California Solar Incentives in 2026
California homeowners access the following incentives:
- Federal 30% Investment Tax Credit (ITC): available to all US homeowners through 2032. On a $22,400 system, this is $6,720 credited directly against your federal income tax bill. Claims IRS Form 5695 in the year of installation.
- Property Tax Exclusion: California’s Active Solar Energy System exclusion prevents your home’s assessed value from being increased by the value of your solar installation — protecting you from higher property taxes through at least 2027.
- No State Sales Tax on Solar: California does not charge sales tax on active solar energy systems, saving $1,500 to $2,500 on a typical installation.
- SELF Programme (Sonoma-Marin): low-interest solar loans for qualifying households in eligible territories.
- SASH and MASH programmes: Single-Family and Multifamily Affordable Solar Housing subsidies for qualifying low-income California households through CPUC’s programmes.
The combined impact: no sales tax, no property tax increase, plus the federal 30% ITC typically reduces a $24,000 system’s effective cost to approximately $14,000 to $16,000. California does not offer a state-level solar income tax credit — the federal ITC is the primary tax incentive.
📊 CPUC: NEM 3.0 Decision and Avoided Cost Calculator
📌 Also Read:
| → How Much Do Solar Panels Save? California State Data → How Long to Pay Off Solar Panels? California Payback → Is Solar Worth It In My Area? — California Section |
Battery Storage Under NEM 3.0 — The Value Case
Under NEM 3.0, the economics of battery storage have shifted from optional to increasingly compelling for most California homeowners. The core logic is straightforward: a kWh you export earns 7¢. A kWh your battery stores and dispatches at 6pm is worth the full 28 to 42¢ import rate you avoid. Every stored kWh is worth 3x to 6x more than an exported kWh.
For an 8kW system that would export 2,500 kWh per year without storage, a battery capturing 80% of that export (2,000 kWh) adds $420 to $700 per year in additional effective savings depending on your utility territory. The 30% ITC applies to the battery, reducing a $12,500 Powerwall 3 to $8,750 net. In SDG&E territory at 38¢/kWh, the battery payback period can be as short as 8 to 10 years.
Is Solar Worth It in California in 2026?
Yes — with the important caveat that the strategy needs to account for NEM 3.0. For PG&E, SCE, and especially SDG&E customers, solar delivers strong financial returns. The combination of high electricity rates, excellent sun hours, no property tax increase, and the federal ITC creates a compelling long-term investment.
The homeowners who see the best returns: those who are home during the day, have an EV to charge, run a pool pump during daylight hours, or add battery storage. Homeowners who are away all day and export 50%+ of generation will see more modest returns under NEM 3.0 — though solar remains financially positive over any 20+ year horizon even in this scenario.
Frequently Asked Questions — California Solar 2026
Is NEM 3.0 really that bad for California solar?
NEM 3.0 extended solar payback periods by approximately 1 to 2 years for typical California systems compared to NEM 2.0. For SDG&E customers at 38¢/kWh, payback remains under 8 years even under NEM 3.0. For PG&E and SCE customers with self-consumption rates of 60%+, payback of 7 to 9 years is achievable. The most affected homeowners are those who export large proportions of their generation without shifting usage or adding storage. Net-net: California solar still pays, but the NEM 3.0 context makes consumption optimisation essential.
What California solar incentives are available beyond the federal ITC?
California does not have a state-level solar income tax credit in 2026. Key incentives are the federal 30% ITC, the property tax exclusion (no added property tax from solar), and the sales tax exemption on solar equipment. Low-income programmes (SASH, MASH, SELF) provide additional support for qualifying households. The DSIRE database at dsireusa.org maintains current listings of all California solar incentives.
How long does solar take to pay off in California?
For SDG&E customers: 6 to 8 years after the 30% ITC, even under NEM 3.0. For PG&E and SCE customers: 7 to 10 years. SMUD customers in Sacramento: 10 to 13 years due to lower rates. Battery-inclusive systems add 1 to 2 years to payback but improve long-term returns under NEM 3.0.
What size solar system does the average California home need?
Average California home consumption is 550 to 700 kWh/month in coastal regions, rising to 900 to 1,200 kWh/month in the hot inland valleys and desert communities. Most 3-bedroom coastal homes need 5 to 7kW. Homes in the Inland Empire, Central Valley, or Coachella Valley with heavy air conditioning often need 8 to 12kW. Under NEM 3.0, slightly undersizing (targeting 80–90% of consumption) is financially optimal as it reduces low-value exports.